 TaxTMI





 06 Nov 2026

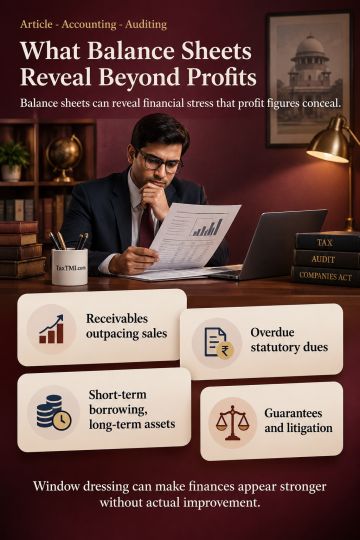
The P&L says how the year went. The balance sheet says whether the business is getting stronger or weaker - and most owners never read it.
In March 2010 a court-appointed examiner published his report into the collapse of Lehman Brothers, the US investment bank whose failure in September 2008 helped ignite a global financial crisis.
One finding stood out: at several quarter-ends, Lehman had used transactions known internally as "Repo 105" to move tens of billions of dollars of assets temporarily off its balance sheet - making leverage look lower precisely when investors and rating agencies were watching.
The earnings told one story. The real balance sheet told another.
The statement owners skip
Many owners read exactly one page of their accounts - the profit and loss. Sales up? Profit up? Good year. The balance sheet is left to the CA and the bank.
That's a mistake. Profit measures performance over a period; the balance sheet measures position at a moment - what the business owns, what it owes and what's left for the owners - and whether that picture is improving or deteriorating.
Lesson from history: the investor's discipline
In 1934, deep in the Great Depression, Benjamin Graham and David Dodd published Security Analysis. Having watched investors ruined by chasing reported earnings, they urged readers to examine what a company actually owned and owed.
Graham's student Warren Buffett built one of history's great investment records on that discipline. The balance sheet is where an optimistic narrative collides with arithmetic.
What the balance sheet shows
Assets = Liabilities + Equity
- Assets - what the business controls: cash, debtors, stock, property, equipment, investments, intangibles.
- Liabilities - what it owes: suppliers, lenders, taxes, employees, customer advances, provisions.
- Equity - what belongs to owners after all liabilities: capital introduced plus accumulated profits, or less accumulated losses.
The Five Health Readings
A doctor takes several readings before judging health. Owners should take five from the balance sheet.
1. Liquidity - can near-term dues be met?
- Current ratio = current assets / current liabilities.
- Quick ratio = (current assets - inventory) / current liabilities.
A weak reading suggests bills may need fresh borrowing. Context matters; some sectors operate safely on lower ratios.
2. Leverage - how much is borrowed?
-
Debt-equity = total borrowings / equity.
Leverage magnifies returns in good years and losses in bad ones. Rising leverage without rising profit is a warning.
3. Lock-up - is money trapped?
Track debtor days, inventory days and creditor days. If debtors and stock outpace sales, cash is being locked away even while profit looks fine.
4. Returns - is it worth the risk?
- Return on equity (ROE) = net profit / average equity.
- Return on capital employed (ROCE) = operating profit / (equity + long-term debt).
A business can be profitable yet earn less than owners could elsewhere with less risk.
5. Net worth - is the foundation growing?
If equity rises year on year through retained profit, the business is strengthening. If it shrinks - through losses or drawings exceeding profit - it's weakening, whatever sales say.
A growing business with a shrinking net worth isn't growing. It's consuming its foundation.
In a nutshell
Essence: read liquidity, leverage, lock-up, returns and net worth together and you'll see what the profit figure can't.
Red flags to look for
- Debtors growing faster than revenue - customers may be struggling or sales booked early.
- Old, static debtors - balances that never move may never be collected.
- Stock rising without sales growth - slow-moving or overvalued.
- Loans and advances to related parties or directors - funds tied up, with governance, legal and tax questions.
- Large "other current assets" or suspense balances - vague items deserve explanation.
- Long-outstanding statutory dues - interest, penalties and legal consequences.
- Short-term borrowing funding long-term assets - refinancing risk.
- Negative net worth - a serious signal to lenders and suppliers and, in some jurisdictions, a trigger for directors' duties.
- Capital work-in-progress that never completes - projects stuck for years may represent lost money.
Window dressing: the Lehman lesson in miniature
Window dressing makes the reporting-date position look better than reality: holding back supplier payments, clearing the overdraft on 31 March and redrawing it on 1 April, booking sales early or parking balances temporarily.
Small businesses sometimes try it before bank reviews. It may work once, but lenders compare month-end balances, auditors test cut-off and patterns emerge. A balance sheet that looks strong only on 31 March isn't strong - it's dressed.
Contingent liabilities: the hidden page
Disputed tax demands, guarantees given and pending litigation may not appear in the headline figures but sit in the notes, and they can crystallise overnight. Owners should know every one by heart.
The uncomfortable reality
Some owners suppress reported profit to cut tax, then wonder why banks won't lend and investors aren't interested. Others report high profits on balance sheets stuffed with uncollectable debtors and unsaleable stock.
Neither picture is honest, and dishonest balance sheets eventually send their bill.
For practitioners: turning the accounts into an owner briefing
- Present a three-year ratio sheet alongside the finalised accounts - the five readings with arrows and one-line explanations.
- Use the Schedule III disclosures. Ageing of receivables and payables, ratio explanations and promoter-loan details are ready-made talking points.
- Walk through the notes. Highlight contingent liabilities, related-party balances and borrowing terms in plain language.
- Bridge profit to cash. Pair the balance sheet with a cash flow statement so the owner sees where money came from and went.
- Flag going-concern indicators early. Negative net worth, persistent liquidity stress or covenant breaches should be discussed before they reach the audit report.
How to use the balance sheet in practice
1. Compare three years side by side - trends say more than a single year.
2. Read the notes - borrowings, contingencies, related parties and policies often hold the real story.
3. Track key ratios quarterly, not only annually.
4. Ask for every significant change to be explained in plain language.
5. Link it to the cash flow statement.
Indicators of success
- Liquidity - current assets comfortably cover current liabilities.
- Leverage - debt falls relative to equity and cash flow.
- Working capital - debtors and stock don't outgrow sales.
- Asset quality - fewer doubtful debts, obsolete stock and idle assets.
- Equity growth - retained profits build net worth year after year.
Outlook: the coming decade
Lenders, investors and suppliers increasingly read balance sheets with automated tools - credit bureau data, GST records and AI-based analysis. Weak balance sheets will be spotted faster and priced higher; strong ones will open doors sooner. Owners who read their own every quarter will see what outsiders see before outsiders act on it.
Immediate actions by role
- Owner: compare this year's balance sheet with the last three, line by line.
- CFO: list assets that may be overstated - old debtors, slow stock, idle equipment.
- Board: add the Five Health Readings to every quarterly review.
- Accountant: reconcile related-party and director-loan balances.
The objection we hear most - and our response
The objection: "I'm not an accountant. Balance sheets are technical. As long as we make a profit and pay the bills, ratios don't matter."
The answer: Nobody needs to be an accountant - five readings and three years of comparison are enough. And "paying the bills" is precisely what the balance sheet forecasts: liquidity and lock-up show whether bills can be paid next quarter, not just this one. Lenders, investors and buyers will read the balance sheet regardless. Better the owner spots the problem first.
Practitioners' FAQ
"What's a good current ratio?"
There's no universal figure. Many analysts treat about 1.2 to 2 as comfortable for typical trading businesses, but fast-turnover retailers can run lower and project businesses may need more. Compare with your own history and sector.
"Is debt always bad?"
No. Debt funding productive assets, with comfortable interest cover and matched tenure, can lift returns. Debt funding losses or drawings is the danger.
"How often should owners look at it?"
At least quarterly; monthly when cash is tight or growth is fast.
"How should a CA explain a falling net worth to a profitable client?"
Show the equity movement: opening capital, plus profit, less drawings or dividends, less losses. Most owners are surprised to see that drawings, not trading results, are eroding the business.
"Which single ratio do lenders look at first?"
It varies, but debt-equity and debt service coverage are usually among the first, followed closely by debtor days and the current ratio.
Position as at October 2026: Indian companies present balance sheets in Schedule III format, which requires disclosures such as ageing of receivables and payables, key ratios with explanations of large changes, and details of loans to promoters and related parties. These disclosures make many of the red flags above visible to lenders and investors automatically.
Pitfalls
- Ignoring the balance sheet because "the CA handles it."
- Focusing only on revenue and profit growth.
- Leaving old, disputed balances uninvestigated.
- Treating related-party loans as harmless.
- Window dressing before bank reviews.
Terms explained
- Current ratio - current assets divided by current liabilities; a basic test of short-term liquidity.
- Net worth - total assets minus total liabilities; the owners' stake.
- Leverage - borrowed money relative to the owners' money.
Misconceptions clarified
- "Profit means the business is healthy." A profitable company can still run out of cash if debtors, stock and short-term debt grow faster than earnings.
- "The balance sheet is only for the auditor and the bank." It's the owner's best early-warning document on liquidity, leverage and working capital.
- "A big reserves figure means money in the bank." Reserves are accumulated profits on paper; they may already be tied up in assets, stock or receivables.
Half-hour action exercise
Place the last three balance sheets side by side and compute the Five Health Readings for each year:
| Reading | Year 1 | Year 2 | Year 3 | Direction |
| Current ratio |
|
|
|
|
| Debt-equity |
|
|
|
|
| Debtor + inventory days |
|
|
|
|
| Return on equity |
|
|
|
|
| Net worth |
|
|
|
|
Mark each trend as improving or worsening. Anything worsening two years running deserves a conversation this month.
Summary for busy professionals
- The balance sheet shows position - what's owned, owed and kept - and Lehman shows how much it can reveal or hide.
- Take the Five Health Readings: liquidity, leverage, lock-up, returns and net worth.
- Watch for rising debtors and stock, related-party advances, vague balances, overdue statutory dues and mismatched funding.
- Window dressing doesn't create strength; it only postpones discovery.
- Compare three years, read the notes, track ratios quarterly and know every contingent liability.
Profit shows how fast a business is moving. The balance sheet shows whether the vehicle will survive the journey.
References
- Anton R. Valukas, Report of Examiner, In re Lehman Brothers Holdings Inc. (US Bankruptcy Court, S.D.N.Y., March 2010).
- Benjamin Graham and David L. Dodd, Security Analysis (McGraw-Hill, 1934).
- Companies Act, 2013 (India), Schedule III (as amended in 2021). mca.gov.in
- Martin Fridson and Fernando Alvarez, Financial Statement Analysis: A Practitioner's Guide (Wiley; multiple editions).