 TaxTMI
 TaxTMI





 04 Nov 2026

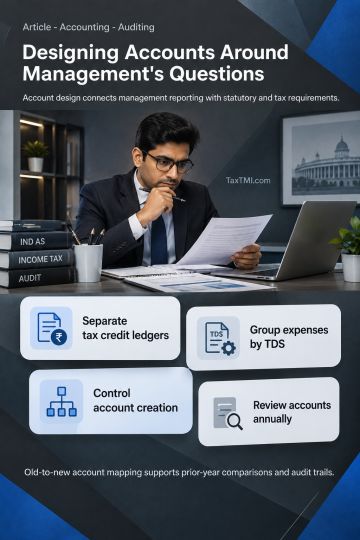
A ledger structure decides which questions the numbers can ever answer. Most SMEs built theirs by accident - and practitioners are best placed to rebuild it.
Scroll through the ledger list of a typical small business and you'll see: "Office Expenses." "General Expenses." "Misc Expenses." "Sundry Expenses." "Other Expenses." "Expenses - Ramesh." "Suspense." "Suspense 2."
Some heads were created years ago and never used again; others hold everything from courier charges to a laptop to a Diwali gift for a customer.
Now ask one simple question: "Which product line actually makes money?" Nobody can answer without days in a spreadsheet. The accountant isn't the problem. The architecture is.
The skeleton of financial information
The chart of accounts lists every account a business uses to record transactions - the skeleton on which all financial information hangs.
Built well, it reveals revenue, margin and cost by product, customer, branch, project or channel automatically every month. Built badly, it may satisfy statutory reporting while concealing exactly what management needs to see.
The books can only answer the questions the chart of accounts was designed to ask.
Lesson from history: structure is the real innovation
When Luca Pacioli described double-entry bookkeeping in 1494, its power lay not only in debits equalling credits but in structure: every transaction filed under a named account, so a merchant could see at any moment what he owned, what he owed and where profit came from.
Five centuries on, governments apply the same idea nationally. India's Ministry of Corporate Affairs requires many companies to file financial statements in XBRL, a structured, tagged format that allows automatic comparison and analysis. Structure turns records into information; without it, records are just a heap.
Five ways a weak chart misleads
1. Everything drifts into "miscellaneous"
Vague heads collect large sums, and what can't be seen can't be analysed.
Correction: keep generic heads small; if any exceeds 2-3% of total expenses, split it.
2. Direct and indirect costs are blended
When freight, packing, commissions and production wages sit beside office rent and admin salaries, gross margin means nothing.
Correction: separate cost of sales - costs that move with each unit sold - from operating expenses. That single change often transforms an owner's view of profitability.
3. No segmentation
A single "Sales" account shows total revenue but not which branch, product, customer type or channel produced it - or which ones lose money.
Correction: use cost centres, cost categories, classes, projects or tags (available in Tally, Zoho Books, QuickBooks and SAP) to analyse segments without spawning hundreds of ledgers.
4. Too many accounts
The reverse problem: thousands of ledgers, many duplicates, created by different people with different naming habits.
Correction: standardise and merge; use sub-ledgers for customers, vendors and employees and tags for detail, not new GL accounts.
5. Statutory and management needs tangled together
Statutory statements require some classifications, management others; one flat structure serves neither.
Correction: design a chart that maps cleanly to statutory formats - Schedule III for Indian companies - and use dimensions for management analysis.
In a nutshell
Essence: vague heads, blended costs and missing segments make a business look understandable on paper while hiding where it really earns and loses money.
The Question-First Ledger
Most charts grow backwards: someone creates ledgers and keeps adding. A better route starts from the questions - the Question-First Ledger, in seven steps.
Step 1: Begin with the questions
What do owners, lenders and managers need to know regularly - margin by product, customer or project; profit by branch; cost per department; return on marketing by channel?
Step 2: Use a logical numbering structure
A common pattern:
| Range | Group |
| 1000s | Assets |
| 2000s | Liabilities |
| 3000s | Equity |
| 4000s | Revenue |
| 5000s | Cost of sales |
| 6000s-7000s | Operating expenses |
| 8000s | Other income and expenses |
| 9000s | Taxes |
Group related heads within each block and leave gaps for future additions.
Step 3: Define dimensions
Decide which analysis will run through cost centres, departments, projects, locations or tags rather than new ledgers.
Step 4: Map to tax and statutory needs
Align heads with GST returns, TDS, income-tax schedules, financial statements and audit requirements.
Step 5: Write a one-page accounting manual
Spell out where common transactions go - "software subscriptions to 6420, not Office Expenses." One page prevents years of inconsistent posting.
Step 6: Restrict account creation
Only finance leadership should create heads; uncontrolled creation is how charts become chaos.
Step 7: Review yearly
As the business changes, evolve the structure deliberately.
Illustration
A distributor sells three product lines through dealers and direct online channels.
Before: one "Sales" account, one "Freight" account mixing inward and outward freight, marketing buried in "General Expenses." The owner believes online is most profitable because prices are higher.
After restructuring:
- Sales split by product line with a channel tag.
- Inward freight moved to cost of sales; outward freight tagged by channel.
- Marketing tagged by channel; payment-gateway charges given their own head.
The discovery: after delivery, returns, marketing and gateway fees, online sales of one line contribute almost nothing, while dealer sales of the "boring" line produce most of the profit. Pricing, marketing and stocking decisions change immediately.
The transactions didn't change. Only the structure did - and the truth became visible.
For practitioners: running a restructuring engagement
- Interview before you design. Ask the owner and department heads for their top five recurring questions; design dimensions around them.
- Build an old-to-new mapping table. Keep it in the working papers so prior-year comparatives and audit trails remain intact.
- Map to Schedule III and XBRL early. Tag each new head to its statutory line to make year-end statements and tagging routine.
- Align GST and TDS heads. Separate input tax credit ledgers by rate and type, and expense heads by TDS section category, to cut reconciliation effort.
- Lock it in the software. Restrict ledger creation rights and set mandatory cost-centre fields for key expense heads.
When to restructure
Mid-year changes complicate comparisons, so the best moments are the start of a financial year, an ERP or software migration, or after an acquisition or business-model change. Always map old accounts to new so history stays comparable.
Indicators of success
- Managers get key answers - margin by product, cost by branch - without manual spreadsheets.
- Miscellaneous heads shrink to a small share of expenses.
- Coding is consistent across branches and people.
- Reporting time falls because data arrives structured.
Outlook: the coming decade
AI tools can read invoices and suggest ledger codes automatically - but they learn from the structure they're given, and a messy chart simply teaches machines to be messy faster. E-invoicing, tax systems and ESG reporting all demand more structured data. A well-designed chart of accounts will underpin automation, analytics and compliance, not just bookkeeping.
Immediate actions by role
- Owner: write down five business questions the accounts should answer.
- Finance head: check whether the current chart answers them without spreadsheets.
- Accountants: review miscellaneous and suspense heads and reclassify large items.
- Department heads: agree cost centres or tags matching how the business is run.
Illustration from a smaller enterprise
Take an illustrative restaurant group with three outlets that records "food purchases" as a single line. The owner can't tell which outlet or menu category is profitable.
The accountant adds simple tags - outlet and category (vegetables, dairy, meat, beverages) - and separates delivery-platform commissions from other selling costs. Within two months the owner sees that delivery orders from one outlet lose money after commissions and discounts, and revises prices and menus there. The data was always present; the chart was hiding it.
The objection we hear most - and our response
The objection: "Our accountant knows where everything is. Changing the chart will confuse everyone and break year-on-year comparisons."
The answer: If only one person knows where everything is, the business has a key-person risk, not a chart of accounts. Change does carry a cost, which is why it should be timed for a year-start or migration, with an old-to-new mapping so comparisons survive. The bigger cost is continuing to price, invest and staff on information that can't answer the questions that matter.
The uncomfortable reality
Many businesses spend heavily on new software expecting better reports - then import the same chaotic chart into the new system. The result is faster chaos.
Software can process information. It can't organise information that was never structured.
Practitioners' FAQ
"How many accounts should a chart have?"
Enough to answer the key questions, not so many that coding becomes inconsistent; use tags or cost centres for detail.
"Can the chart change mid-year?"
Yes, carefully, with an old-to-new mapping so comparisons hold.
"Who should design it?"
Finance, with input from owners and department heads on the questions they need answered.
Position as at October 2026: Indian companies must present financial statements in Schedule III format and use accounting software with a non-disableable audit trail; specified companies file in XBRL. GST returns, e-invoicing and TDS returns draw on ledger data, so mapping accounts correctly to tax categories reduces mismatches. Confirm current filing taxonomies before redesigning.
Pitfalls
- Ledgers named after people ("Expenses - Suresh").
- Suspense accounts used as permanent storage.
- Changing how accounts are used without documentation.
- Management reports built entirely in spreadsheets outside the system.
- Letting every user create new heads.
Terms explained
- Chart of accounts - the full list of account heads used to record transactions.
- Cost centre - a part of the business, such as a branch or department, whose costs are tracked separately.
- Tag or dimension - an extra label on a transaction, such as product or region, enabling more detailed reports.
- Suspense account - a temporary head for entries whose correct classification isn't yet known.
Half-hour action exercise: the health check
Answer yes or no:
1. Can we see gross margin by product or service line within minutes?
2. Are miscellaneous expenses under 2-3% of total expenses?
3. Would two accountants post the same transaction to the same head?
4. Does the chart map easily to statutory statements?
5. Is there a written rule on who may create new heads?
Every "no" marks a place where the numbers are hiding something. Fix one before the next month-end.
Summary for busy professionals
- The chart of accounts decides what financial information can reveal.
- Vague heads, blended costs, missing segments and duplicate ledgers hide real profitability.
- Build a Question-First Ledger: questions, numbering, dimensions, statutory mapping, a one-page manual, controlled creation and annual review.
- Restructure at year-start or during migration, with clear old-to-new mapping.
- Software can't organise information that was never structured.
Good structure turns bookkeeping into business intelligence.
References
- Luca Pacioli, Summa de arithmetica, geometria, proportioni et proportionalita (Venice, 1494).
- Companies Act, 2013 (India), Schedule III; Companies (Filing of Documents and Forms in XBRL) Rules, 2011. mca.gov.in
- Charles T. Horngren, Srikant M. Datar and Madhav V. Rajan, Cost Accounting: A Managerial Emphasis (Pearson; multiple editions).
- Robert S. Kaplan and Steven R. Anderson, Time-Driven Activity-Based Costing (Harvard Business School Press, 2007).