TaxTMI
 Login
 TaxTMI
Login
Loading...
Press 'Enter' to add multiple search terms. Rules for Better Search

Press 'Enter' after typing page number.
Press 'Enter' after typing page number.


No Folders have been created
Are you sure you want to delete "My most important" ?
NOTE:
Press 'Enter' after typing page number.
Press 'Enter' after typing page number.

All News
Press 'Enter' after typing page number.
All News

Note

Bookmark

Share


Merchandise exports during April 2026 were US$ 43.56 Billion, as compared to US$ 38.28 Billion during April 2025, registering a positive growth of 13.78%
Non-Petroleum exports during April 2026 valued at US$ 33.97 Billion registered an increase of 9.01% as compared to US$ 31.16 Billion during April 2025
Major drivers of merchandise exports growth in April 2026 include Petroleum Products, Electronic Goods, Engineering Goods, Meat, Dairy & Poultry Products and Drugs & Pharmaceuticals
Petroleum Products exports increased by 34.66 % from US$ 7.12 Billion in April 2025 to US$ 9.59 Billion in April 2026
Electronic Goods exports increased by 40.31 % from US$ 3.69 Billion in April 2025 to US$ 5.18 Billion in April 2026
Engineering Goods exports increased by 8.76 % from US$ 9.52 Billion in April 2025 to US$ 10.35 Billion in April 2026
Meat, Dairy & Poultry Products exports increased by 48.03 % from US$ 0.37 Billion in April 2025 to US$ 0.55 Billion in April 2026
Drugs & Pharmaceuticals exports increased by 7.12 % from US$ 2.49 Billion in April 2025 to US$ 2.66 Billion in April 2026
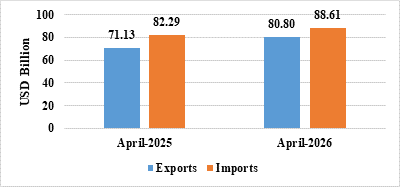
India’s total exports (Merchandise and Services combined) for April 2026* is estimated at US$ 80.80 Billion, registering a positive growth of 13.59 percent vis-à-vis April 2025. Total imports (Merchandise and Services combined) for April 2026* is estimated at US$ 88.61 Billion, registering a positive growth of 7.67 percent vis-à-vis April 2025.
Table 1: Trade during April 2026*
|
|
| April 2026 (US$ Billion) | April 2025 (US$ Billion) |
| Merchandise | Exports | 43.56 | 38.28 |
| Imports | 71.94 | 65.38 | |
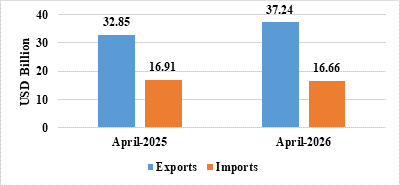
| Services* | Exports | 37.24 | 32.85 |
| Imports | 16.66 | 16.91 | |
| Total Trade (Merchandise +Services) * | Exports | 80.80 | 71.13 |
| Imports | 88.61 | 82.29 | |
| Trade Balance | -7.81 | -11.16 |
* Note: The latest data for services sector released by RBI is for March 2026. The data for April 2026 is an estimation. (ii) Data for April 2025 has been revised on pro-rata basis using quarterly balance of payments data.
Fig 1: Total Trade during April 2026*
MERCHANDISE TRADE
Fig 2: Merchandise Trade during April 2026
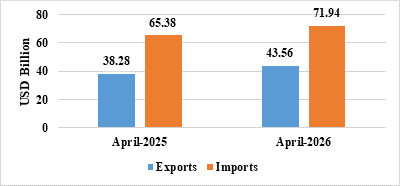
Table 2: Trade excluding Petroleum and Gems & Jewellery during April 2026
|
| April 2026 (US$ Billion) | April 2025 (US$ Billion) |
| Non- petroleum exports | 33.97 | 31.16 |
| Non- petroleum imports | 53.32 | 44.68 |
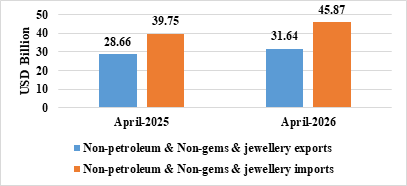
| Non-petroleum & Non-Gems & Jewellery exports | 31.64 | 28.66 |
| Non-petroleum & Non-Gems & Jewellery imports | 45.87 | 39.75 |
Note: Gems & Jewellery Imports include Gold, Silver & Pearls, precious & Semi-precious stones
Fig 3: Trade excluding Petroleum and Gems & Jewellery during April 2026
SERVICES TRADE
Fig 4: Services Trade during April 2026*