

Loading...

Top
Help
×

By creating an account you can:

Logo TaxTMI
Call Us / Help / Feedback

Contact Us At :

E-mail: [email protected]

Call / WhatsApp at: +91 99117 96707

For more information, Check Contact Us

FAQs :

To know Frequently Asked Questions, Check FAQs

Most Asked Video Tutorials :

For more tutorials, Check Video Tutorials

Submit Feedback/Suggestion :

Email :
Please provide your email address so we can follow up on your feedback.
Category :
Description :
Min 15 characters 0/2000
Make Most of Text Search
  1. Checkout this video tutorial: How to search effectively on TaxTMI.
  2. Put words in double quotes for exact word search, eg: "income tax"
  3. Avoid noise words such as : 'and, of, the, a'
  4. Sort by Relevance to get the most relevant document.
  5. Press Enter to add multiple terms/multiple phrases, and then click on Search to Search.
  6. Text Search
  7. The system will try to fetch results that contains ALL your words.
  8. Once you add keywords, you'll see a new 'Search In' filter that makes your results even more precise.
  9. Text Search
Add to...
You have not created any category. Kindly create one to bookmark this item!
Create New Category
Hide
Title :
Description :
❮❮ Hide
Default View
Expand ❯❯
Close ✕
🔎 News - Adv. Search
TEXT SEARCH:

Press 'Enter' to add multiple search terms. Rules for Better Search

Search In:
Main Text + AI Text
  • Main Text
  • Main Text + AI Text
  • AI Text
Category: ?
Categorized by AI
---- All Categories ----
  • ---- All Categories ----
  • Income Tax
  • GST
  • Customs, DGFT & SEZ
  • FEMA & RBI
  • Corp. Laws, SEBI & IBC
  • PMLA, Black Money & ED
  • Budget
  • News and Press Release
  • PTI News
Month:
---- All Months ----
  • ---- All Months ----
  • January
  • February
  • March
  • April
  • May
  • June
  • July
  • August
  • September
  • October
  • November
  • December
Year:
---- All Years ----
  • ---- All Years ----
  • 2026
  • 2025
  • 2024
  • 2023
  • 2022
  • 2021
  • 2020
  • 2019
  • 2018
  • 2017
  • 2016
  • 2015
  • 2014
  • 2013
  • 2012
  • 2011
Sort By: ?
In Sort By 'Default', exact matches for text search are shown at the top, followed by the remaining results in their regular order.
Relevance Default Date
    No petrol, diesel price hike despite global oil prices spiking to USD 80
    West Asia crisis: TCS, Wipro halt travel to Middle East, Nasscom urges remote work
    Mizoram to intensify crackdown on areca nuts smuggling, 468 cases registered since 2019: Minister
    Global markets roiled as conflict in Middle East spreads, energy prices soar
    Department of Commerce convenes Stakeholder Consultation to ensure trade continuity amid evolving geopolitical developments
    CAD widens to USD 13.2 bn in Q3 on higher trade deficit: RBI
    Gross and Net GST revenue collections for the month of Feb, 2026
    Govt discusses potential impact of West Asia crisis on trade; ensures all facilitation
    Rupee crashes 42 paise to settle at 91.50 against US dollar
    J&K to import 4 elite foreign breeds of sheep, goat
    Oil prices soar and stock prices fall as US-Israel war with Iran rattles markets
    India's manufacturing sector activity growth jumps to 4-month high in Feb: PMI
    Arkel invests RS.100 Cr in Phase 1, Opens Advanced Lift Control Manufacturing Facility
    Two-day Workshop by DFS on Reservation Policy of Government of India and Accessibility for PwDs concludes
    Central Board of Indirect Taxes and Customs (CBIC) introduces deferred Customs Duty payment facility for Eligible Manufacturer Importers as announced ...
    US futures, Asian shares open lower, oil prices soar as US and Israeli attack Iran
    Rupee falls 21 paise to 91.29 against US dollar in early trade
    Oil prices rise sharply after attacks in Middle East disrupt global energy supply
    Oil prices rise sharply in market trading after attacks in Middle East disrupt global energy supply
    OPEC+ boosts oil production after attacks on Iran and throughout region
❯❯
Maximize Maximize Maximize
0 / 200
Expand Note
Add to Folder

No Folders have been created

+

Are you sure you want to delete "My most important" ?

NOTE:

News
Showing Results for :
Reset Filters
Results Found:
Show All Summaries Hide All Summaries
March 2, 2026
Show AI Summary
Fuel pricing policy shields consumers by using company-held margins to stabilize retail petrol and diesel amid global crude spikes.
India's fuel pricing policy freezes retail petrol and diesel prices by allowing public sector oil companies to absorb losses when international crude prices rise and build margins when prices fall; this cushion-based approach, overseen by the Oil Ministry, will continue unless a sustained, very large spike in crude or prolonged disruptions (notably via the Strait of Hormuz) make it untenable, exposing vulnerabilities from high import dependence and increased procurement, freight, and insurance costs.
March 2, 2026
Show AI Summary
Travel suspension to Middle East prompts IT firms to enforce employee safety measures and remote work arrangements.
Indian IT firms have suspended or deferred travel to the Middle East and implemented employee safety measures: TCS suspended all incoming and outgoing travel, advised associates to stay indoors, activated a call tree, and is coordinating with local authorities and embassies; Wipro issued a no travel advisory for multiple countries and directed regional staff to follow local guidance. Nasscom advised members to defer travel and enable work from home arrangements as a precaution while monitoring operations and preparing further measures if required.
March 2, 2026
Show AI Summary
Customs enforcement against areca nut smuggling intensified, emphasising prosecution under prohibitory orders and strengthened border surveillance.
Intensified enforcement targets areca nut smuggling from Myanmar due to evasion of import duties and market harm to local growers. Authorities have registered numerous cases and made arrests under prohibitory-order offences prosecuted via the Indian Penal Code and the Bharatiya Nagarik Suraksha Sanhita, and separate prosecutions under the Customs Act. The government affirms continued prohibition, enhanced border surveillance, and a zero-tolerance stance including probes into alleged official complicity.
March 2, 2026
Show AI Summary
Energy supply disruption risks push global markets lower as oil and gas price spikes strain trade and inflation expectations.
Energy supply disruptions from Middle East hostilities sharply pushed up oil, gas and fuel prices, driving marketwide volatility as investors rotated into safe havens. Attacks affecting transit through the Strait of Hormuz threaten continuity of crude and LNG exports, prompting buyers to seek alternate sources and tightening physical markets. Higher wholesale inflation readings increase the prospect of delayed monetary easing, reinforcing downward pressure on risk assets and elevating short term downside risk to trade and investment flows.
March 2, 2026
Show AI Summary
Trade continuity secured through coordinated facilitation and procedural flexibility to protect exporters and sustain EXIM logistics.
The Department of Commerce convened a multi stakeholder consultation to coordinate regulatory and operational measures for EXIM logistics amid geopolitical developments, focusing on real time monitoring of routing, capacity, surcharges and equipment availability, and strengthening facilitation at ports and ICDs to prevent congestion. The Government emphasised a facilitative, coordinated approach prioritising supply chain resilience and exporter interests, agreeing measures including procedural flexibility for export authorisations, Customs coordination for smooth clearance, financial and insurance engagement, and prioritisation of time sensitive export segments.
March 2, 2026
Show AI Summary
Current account deficit rises due to widening trade deficit; services surplus partially offsets external imbalance.
Current account deficit widened to USD 13.2 billion in the December quarter, driven mainly by a larger merchandise trade deficit, while net services receipts rose and partially offset the deterioration; the April-December current account deficit moderated compared with the prior year, reflecting goods and services flow dynamics within the balance of payments.
March 2, 2026
Show AI Summary
GST revenue collections: gross receipts, refunds and net receipts reported, with state settlements and cess treatment noted.
Statement of February 2026 GST revenues detailing gross receipts by CGST, SGST and IGST (domestic and import), reported refunds (domestic and export/ICEGATE) and resulting net GST revenue split into net domestic and net customs receipts. It separately reports compensation and import cess inflows and refunds, noting compensation cess remains transitory until loan liabilities are discharged. State/UT pre- and post-settlement SGST distributions and Apr-Feb collection breakdowns by Central and State formations are included for inter-year comparison.
March 2, 2026
Show AI Summary
Trade facilitation measures to mitigate West Asia crisis impact on exports, including customs coordination and logistical support.
The consultation assessed risks to EXIM cargo flows from West Asian hostilities and committed a facilitative, coordinated response focused on preserving trade continuity. Agreed measures include real-time monitoring of routing, capacity, surcharges and equipment availability; strengthened port/ICD facilitation to avoid congestion; targeted support for time-sensitive exports such as perishables and pharmaceuticals; procedural flexibility for export authorisations in genuine disruption; Customs coordination for smooth clearance; and engagement with financial and insurance institutions to protect exporter interests, with emphasis on MSMEs and essential imports.
March 2, 2026
Show AI Summary
Exchange rate pressure intensified as geopolitical conflict, crude price spikes and capital outflows pushed the currency lower despite central bank support.
Severe exchange rate pressure drove the rupee sharply lower amid geopolitical conflict, FII outflows and rising crude prices, increasing India's import bill vulnerability; the Reserve Bank of India's visible market presence capped deeper intraday depreciation while analysts warned that geopolitical developments, crude trends, capital flows and key US data will determine near term exchange rate direction.
March 2, 2026
Show AI Summary
Genetic upgrade initiative boosts local mutton and wool production via import of elite sheep and goat breeds.
Importation of Romanov and Finn sheep and Boer and Swiss Alpine goats aims to implement a genetic upgrade of Jammu and Kashmir's small ruminant population to improve growth rates, carcass yield, reproductive efficiency and overall flock productivity. Imported germplasm will be multiplied at government breeding farms and progeny distributed to farmers in phases, with farmer-level distribution starting in the third quarter of 2026-27, as part of Project 24 under the Holistic Agriculture Development Programme alongside complementary livestock and rural productivity measures.
March 2, 2026
Show AI Summary
Oil supply disruption risk drives markets as geopolitical attacks push energy prices up and equities downward.
Attacks on Iran caused equity declines and sharp rises in oil and gold as traders priced in disruption to energy flows through the Strait of Hormuz; sustained interruptions to Iranian exports and regional shipping could tighten global supply, elevate fuel and production costs, affect major importers' sourcing strategies, and influence inflation dynamics and central bank rate decisions.
March 2, 2026
Show AI Summary
Manufacturing activity growth driven by stronger domestic demand despite slower export orders, prompting higher input buying and hiring.
Manufacturing activity accelerated to a four-month high as stronger domestic demand supported faster output growth and higher new business intakes; firms increased input purchasing, inventories and hiring. New export orders continued to slow, somewhat constraining employment creation. Cost pressures remained moderate, and forward-looking sentiment was positive with many manufacturers expecting higher output over the year ahead.
March 2, 2026
Show AI Summary
Compliance with IS-17900 drives local manufacturing of advanced lift control systems, reducing import dependence and strengthening supply chains.
A Phase 1 manufacturing facility invests in local production of advanced lift electronic control systems designed to comply with IS-17900, reduce import dependency, and enable component to finished product localisation. The plant will operate automated PCB and semi automatic panel lines to produce MR, MRL and Slim Panels, emphasise controlled environment quality, IoT features, and support supply chain resilience and national industrial policy objectives under the Make in India framework.
March 2, 2026
Show AI Summary
Reservation policy implementation strengthened across public financial institutions to improve accessibility and uniform compliance measures.
Strengthening institutional capacity for uniform implementation of the Government of India's reservation policy across public financial institutions and enhancing accessibility for Persons with Disabilities were the primary objectives. The programme combined a Sugamya Bharat sensitisation session on accessibility standards and compliance requirements, a roundtable on legal provisions and practical challenges, exchange of best practices, and an interactive question-and-answer session to identify operational measures for inclusivity, accessibility and reservation policy compliance.
March 2, 2026
Show AI Summary
Deferred Customs Duty payment enables qualified manufacturers to clear imports and pay duties monthly, subject to compliance and eligibility.
A Deferred Customs Duty payment facility allows Eligible Manufacturer Importers to clear imports without immediate duty payment and to pay applicable customs duties monthly under the Deferred Payment of Import Duty Rules, 2016, subject to prescribed Customs and GST compliance, turnover, financial standing and track record; existing AEO T1 entities meeting eligibility may participate and applications are to be submitted via the AEO portal.
March 2, 2026
Show AI Summary
Energy supply disruption risks trigger global market selloff and safe-haven flows, lifting oil and gold while bond yields fall.
Global markets moved to risk-off after US and Israeli attacks on Iran: equities opened lower while gold and government bonds rallied and oil prices surged on fears that strikes and incidents in the Strait of Hormuz could restrict oil and LNG exports, raising the prospect of higher energy and production costs; higher-than-expected wholesale inflation readings were identified as a factor that may affect the central bank's timing for interest-rate cuts.
March 2, 2026
Show AI Summary
Rupee depreciation driven by crude price surge, dollar strength and foreign fund outflows pressures local currency lower.
Rupee depreciation in early trade reflected external pressures-higher crude prices, a stronger US dollar, and escalated Middle East tensions-compounded by negative domestic equity sentiment and significant foreign institutional outflows. Market indicators included a firmer dollar index, rising Brent crude futures, and a recent dip in forex reserves, while analysts warned of increased import bill risk due to India's reliance on fuel imports.
March 2, 2026
Show AI Summary
Energy supply disruption threatens global oil flows, driving sharp price increases and straining fuel and goods markets worldwide.
Attacks and retaliatory strikes in the Middle East disrupted flows through the Strait of Hormuz and regional export infrastructure, triggering sharp crude price rises and heightened risk of sustained supply constraints; OPEC+ announced production increases, but analysts stress that constrained export routes limit the immediate effectiveness of added output.
March 2, 2026
Show AI Summary
Maritime chokepoint security threatened, risking oil export disruptions and limiting the relief from increased production.
Attacks and military strikes in the Middle East disrupted maritime traffic through the Strait of Hormuz, risking restrictions on regional crude exports and driving upward pressure on oil and gasoline prices. Because the strait is a critical global oil chokepoint, market concerns focus on whether barrels can physically move; consequently, OPEC+ announcements of increased production may provide limited immediate relief if export routes remain constrained.
March 2, 2026
Show AI Summary
Oil supply security: production increases meet limited relief when export routes through the Strait of Hormuz are disrupted.
OPEC+ announced an April increase in crude production intended to augment available supply while regional military attacks and disruptions to tanker movements - particularly through the Strait of Hormuz - threaten export routes. The notice underscores that interruptions to transit can limit the relief additional output provides and that access to export channels will be decisive for near-term market stability and price direction.

News

Back

All News

Showing Results for :
Reset Filters
No Records Found

News

Back

All News

Showing Results for : Reset Filters
Customs, DGFT & SEZ

Directorate General of Commercial Intelligence and Statistics Revises Base Year of Merchandise Trade Indices to FY 2022–23 to Reflect Current Trade Structure and Global Patterns

February 21, 2026

Contents
Summary
Note

Note

-

Bookmark

Print

Print

Merchandise Trade Indices are compiled and published by the Directorate General of Commercial Intelligence and Statistics (DGCI&S), Ministry of Commerce & Industry, to measure changes in the unit values (prices) of India’s exports and imports over time. These indices serve as important indicators of external sector price movements and are widely used for economic analysis, including national accounts compilation and assessment of terms of trade. Over the years, the base year of the indices has been periodically revised to reflect structural changes in India’s trade composition and evolving global trade patterns. The most recent revision updates the base year to FY 2022–23 (2022–23 = 100), replacing the earlier base of FY 2012–13, thereby ensuring that the indices accurately represent the current structure of India’s merchandise trade.

Revision of Base Year of India’s Merchandise Trade Indices to FY 2022–23

The Directorate General of Commercial Intelligence and Statistics (DGCI&S), Ministry of Commerce & Industry, has revised the base year of India’s Merchandise Trade Indices from FY 2012–13 to FY 2022–23 (2022–23 = 100), in view of the structural changes in the economy, shifts in commodity composition, evolving trade patterns, and the need for improved alignment with contemporary macroeconomic indicators.

The revision has been undertaken on the recommendations of a committee constituted by DGCI&S under the Chairmanship of Prof. Nachiketa Chattopadhyay, Professor, Indian Statistical Institute, Kolkata. The Committee examined the existing methodology, data coverage, weighting structure, and compilation practices, and recommended suitable refinements in line with international best practices.

Key Features of the Revised Series (Base: FY 2022–23)

  1. Updated Base Year:
    The new base year FY 2022–23 makes the Indices reflect the current structure of India’s external trade more accurately.
  2. Revised Commodity Basket:
    The coverage and classification of commodities have been reviewed at the Principal Commodity level to better capture emerging and declining trade items.
  3. Revised Weighting Structure:
    Weights have been updated based on trade values of the new base year to reflect the latest value shares in exports and imports.
  4. Improved Methodology:
    Methodological refinements have been introduced in:
    1. Selection of common commodity basket for base year selection (procedure of selection for common commodity basket explained in detail report of the committee).
    2. Treatment of missing unit values (Imputation of missing unit values in base year selection have been explained in detail in the committee report).
  5. Indices Compiled:
    The revised series includes:
    1. Monthly, Quarterly and Annual Indices (Export Unit Value Index,Import Unit Value Index).
    2. Principal Commodity (PC) Classification wise Trade Indices (Export/Import).
    3. Standard International Trade Classification-wise (SITC) Trade Indices.
    4. Broad economic categories-wise (BEC) Trade Indices.
    5. Bilateral and Region-wise Trade Indices of Top 20 Export and Import partner nations of India.
    6. Terms of Trade (Gross terms of trade, Net terms of trade and Income terms of trade).

Rationale for Revision

Over the past decade, India’s trade basket has undergone substantial changes due to emergence of new commodities, technological advancements, Global supply chain restructuring and changes in relative price structures.

The earlier base year (FY 2012–13) no longer adequately reflected the prevailing trade structure. The revision ensures improved relevance, reliability, and analytical usefulness of the Merchandise Trade Indices for policymakers, researchers, and other stakeholders.

Use of the Revised Series

Merchandise Trade Indices compiled by the Directorate General of Commercial Intelligence and Statistics (DGCI&S) are extensively used by key government institutions for economic analysis and policy formulation. The National Accounts Division (NAD) of the Ministry of Statistics and Programme Implementation uses the Export and Import Unit Value Indices as deflators for estimating real exports and imports in GDP compilation. The Reserve Bank of India (RBI) relies on these indices for external sector assessment, balance of payments analysis, and evaluation of price competitiveness. Various Ministries and Government agencies also use them to frame and review trade-related policies and to assess movements in international prices. In addition, academic institutions, research organizations, and economic analysts utilize Merchandise Trade Indices for empirical research, modelling, and analysis of trade dynamics and terms of trade trendson and economic research.

Availability of Data

The revised Merchandise Trade Indices (Base: FY 2022–23) will be released on the official website of DGCI&S. Detailed methodological documentation is available in the Report of the Committee on Revision of Base Year for Merchandise Trade Indices.

Comparison of the new revised Indices (Base Year: 2022-23) with the already released Indices (Base Year : 2012-13) for 2022-23 and 2023-24 is given below.
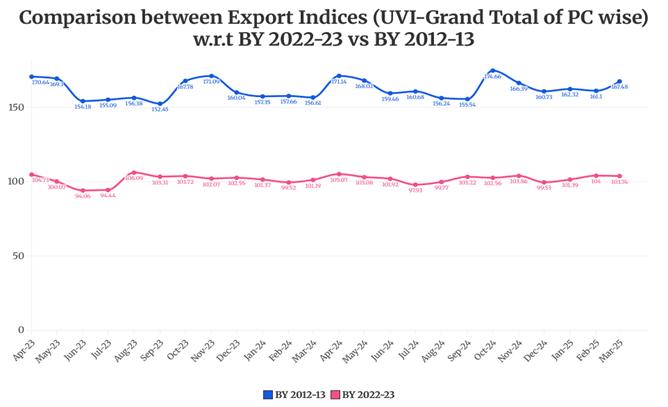
#BY means Base Year.
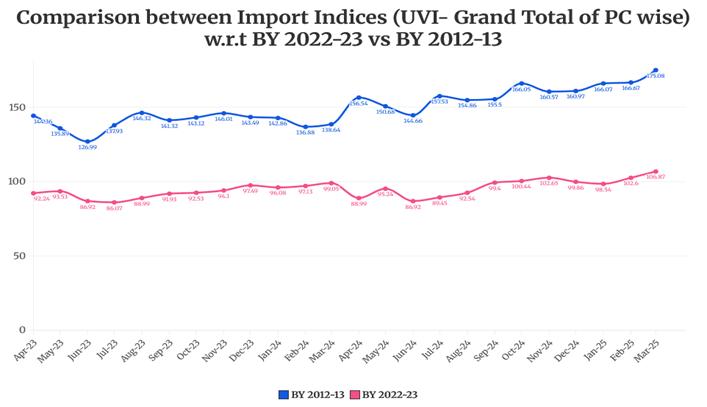
 

#BY means Base Year.

Table: Unit Value Index (UVI) and Quantity Index (QI) during FY 2025-26(Apr-Nov) using FY 2022-23 as base year


Month

Apr_25

May_25

Jun_25

1st Qtr 25-26

Jul_25

Aug_25

Sep_25

2nd Qtr 25-26

Oct_25

Nov_25

Unit Value Index

Export

105.31

99.73

96.31

100.33

99.31

100.55

104.08

101.23

103.78

105.32

Import

92.33

97.97

91.74

94.08

96.34

100.81

108.69

101.93

110.17

106.59

Quantity Index

Export

107.85

104.76

93.88

101.91

103.41

102.64

111.04

105.57

116.19

113.06

Import

138.16

126.61

112.58

125.17

122.47

124.06

126.45

124.32

137.04

121.75

Qtr  means Quarter.

Meaning and interpretation of the Indices

The Unit Value Indices and the Quantity Indices may be interpreted along the following lines.

The Unit Value Index answers the question: What is the growth in the average Unit Value of the items1 traded in the current month with respect to the same month in the Base Year?

So, an Unit Value Index of, say, 120 means that if the items that have been traded in the current month had been traded in the same month of the base year, and if the average price (or unit value) of those items had been Rs.100 in that month of the base year, then the average price (or unit value) of these items in the current month is Rs.120. Or that, there is a 20% increase in the average Unit Value, with respect to the Base Year, of the items that have been traded in the Current Month.

For example, let us suppose 30 items, 10 items each from 3 different Principal Commodities, have been traded in the current month. If these 30 items had been traded in the corresponding month of the base year at an average price of Rs.100, then the average price of these items in the current year is Rs.120.

It is to be noted that there are two successive steps of averaging done here. The first averaging is done over all the items (or ITCHS) of a PC group to arrive at the Index of that PC group. And the second averaging is done over all the PC groups to arrive at the Index at the Grand Total level for all commodities (which is the overall Index for India for a month). In both the stages, a weighted average is taken where the weights are proportional to the importance of the items and the PC groups respectively, and the Laspeyres Formula is used for averaging.

Quantity Indices, say, 200 means that if in the base year on an average 100 units were traded in India in the base year, then in the current year on an average 200 units were traded. However, it must be remembered that averaging quantities are different from averaging prices, since quantities in different units cannot be added directly.

So, the Quantity Indices are calculated by dividing the Value Indices by the Unit Value Indices. For example, if there is an increase in the Value of Export from Rs. 10,000 to Rs. 24,000, then the Value Index is 24000/10000 × 100 = 240. If the Unit Value Index is 120, then the Quantity Index comes to 240/120 × 100 = 200. So, loosely it can be said that, if the value of export has increased 2.4 times and the price of the commodities has increased 1.2 times, then the quantity must have doubled.

However, it may be noted that a very high or low Quantity Index may indicate the presence of Base Effect.

The Interpretation of the Bilateral and Regional Indices can be seen as an extension of the above.

A Unit Value Index of 120 with respect to a country, say Bangladesh, means that if all the items that have been traded with Bangladesh in the current month had been traded in the same month of the base year with the same country, and if the average price (or unit value) of those items had been Rs.100 in that month of the base year, then the average price (or unit value) of these items in the current month is Rs.120.

Similarly, a Quantity Index of 200 with respect to a country, say Bangladesh, means that if in the base year on an average 100 units were traded in India in the base year, then in the current year on an average 200 units were traded.

Comparability of the Indices across time

It is to be noted that the weights in the Index Number formula are fixed across time and there are twelve sets of weights for the twelve months. Hence, comparability of Indices is meaningful only when Indices of same month are compared across years. Different months may attach different weights to the same item, and hence comparing indices of two different months becomes vague and may have little applicability.

Further, the weights of the items that are not present in the trade basket of the current month are distributed to all the items that have been traded in the current month. This distribution is done in proportion to the weights of those items.

For example, let us suppose there are only 3 commodities for trade, say A, B and C. In month May of the Base year, let us suppose that the trade value of A was Rs. 50, B was Rs. 100 and C was Rs. 50. Then the weights assigned to A, B and C in the month of May of the following years would be in the ratio 50 :100 :50. However, in case, C is not traded in the current month, then the weight of C would be distributed proportionately among A and B, again in the ratio 1:2 (since in May the weights of A and B are in the ratio of 50 : 100, i.e., 1 : 2). So, in the current month the weights of A and B would be 3313  and 6623 .

As a result, the weights in any two given months are dependent on exactly the number of items (ITCHS codes) traded in those months. If the items traded are widely different, inference drawn from the comparison of the Indices may be done accordingly. On the other hand, more the similarity in the number of items traded more is the comparability of the two indices.

Net Terms of Trade:

Net Terms of Trade also called commodity Terms of Trade is defined as a ratio of export prices to import prices.

Let say 2022-23 be the base year and 2023-24 be the final year. We express both export and import prices in 2022-23 as 100. Now, suppose that at the end of 2023-24, it is found that the index of export prices decreased to 90 and index of import prices roses to 150. Then the Net Terms of Trade has changed to 90100150100=35 . Then terms of trade as index=35*100=60 . It implies that terms of trade of the country have decreased by about 40% in 2023-24 as compared with 2022-23. It thus shows a deterioration or a worsening of the terms of trade of the country.

If the index of export prices has risen to 150 and that of import prices had risen to 120, then the net terms of trade would have changed to 150120*100=125 . This implies an improvement in the net terms of trade of the country by 25% in 2023-24 over 2022-23.

Gross Terms of Trade:

Gross Terms of Trade is the ratio of physicalquantity of import to physical quantity of export.

Let say 2022-23 be the base year. In that year, the quantities export and import are denoted by 100. Now, suppose that in the year 2023-24, the index of quantity of import was 150 and that of quantity of export was 120. Then the gross terms of trade is given by 150100120100=54,  in terms of percentage =54*100=125 . This implies that there was an improvement of gross terms of trade by 25% in 2023-24 compared to 2022-23.

Income Terms of Trade: Income Terms of Trade is defined as- Net Terms of Trade multiplied by quantity of export.

Topics

Acts Income Tax