 TaxTMI
 Login
 TaxTMI
Login
Loading...
Press 'Enter' to add multiple search terms. Rules for Better Search

Press 'Enter' after typing page number.
Press 'Enter' after typing page number.


No Folders have been created
Are you sure you want to delete "My most important" ?
NOTE:
Press 'Enter' after typing page number.
Press 'Enter' after typing page number.

All News
Press 'Enter' after typing page number.
All News

Note

Bookmark

Share


Merchandise Trade Indices are compiled and published by the Directorate General of Commercial Intelligence and Statistics (DGCI&S), Ministry of Commerce & Industry, to measure changes in the unit values (prices) of India’s exports and imports over time. These indices serve as important indicators of external sector price movements and are widely used for economic analysis, including national accounts compilation and assessment of terms of trade. Over the years, the base year of the indices has been periodically revised to reflect structural changes in India’s trade composition and evolving global trade patterns. The most recent revision updates the base year to FY 2022–23 (2022–23 = 100), replacing the earlier base of FY 2012–13, thereby ensuring that the indices accurately represent the current structure of India’s merchandise trade.
Revision of Base Year of India’s Merchandise Trade Indices to FY 2022–23
The Directorate General of Commercial Intelligence and Statistics (DGCI&S), Ministry of Commerce & Industry, has revised the base year of India’s Merchandise Trade Indices from FY 2012–13 to FY 2022–23 (2022–23 = 100), in view of the structural changes in the economy, shifts in commodity composition, evolving trade patterns, and the need for improved alignment with contemporary macroeconomic indicators.
The revision has been undertaken on the recommendations of a committee constituted by DGCI&S under the Chairmanship of Prof. Nachiketa Chattopadhyay, Professor, Indian Statistical Institute, Kolkata. The Committee examined the existing methodology, data coverage, weighting structure, and compilation practices, and recommended suitable refinements in line with international best practices.
Key Features of the Revised Series (Base: FY 2022–23)
Rationale for Revision
Over the past decade, India’s trade basket has undergone substantial changes due to emergence of new commodities, technological advancements, Global supply chain restructuring and changes in relative price structures.
The earlier base year (FY 2012–13) no longer adequately reflected the prevailing trade structure. The revision ensures improved relevance, reliability, and analytical usefulness of the Merchandise Trade Indices for policymakers, researchers, and other stakeholders.
Use of the Revised Series
Merchandise Trade Indices compiled by the Directorate General of Commercial Intelligence and Statistics (DGCI&S) are extensively used by key government institutions for economic analysis and policy formulation. The National Accounts Division (NAD) of the Ministry of Statistics and Programme Implementation uses the Export and Import Unit Value Indices as deflators for estimating real exports and imports in GDP compilation. The Reserve Bank of India (RBI) relies on these indices for external sector assessment, balance of payments analysis, and evaluation of price competitiveness. Various Ministries and Government agencies also use them to frame and review trade-related policies and to assess movements in international prices. In addition, academic institutions, research organizations, and economic analysts utilize Merchandise Trade Indices for empirical research, modelling, and analysis of trade dynamics and terms of trade trendson and economic research.
Availability of Data
The revised Merchandise Trade Indices (Base: FY 2022–23) will be released on the official website of DGCI&S. Detailed methodological documentation is available in the Report of the Committee on Revision of Base Year for Merchandise Trade Indices.
Comparison of the new revised Indices (Base Year: 2022-23) with the already released Indices (Base Year : 2012-13) for 2022-23 and 2023-24 is given below.
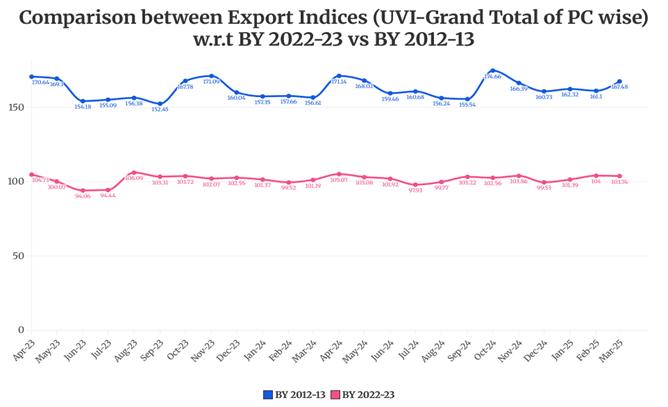
#BY means Base Year.
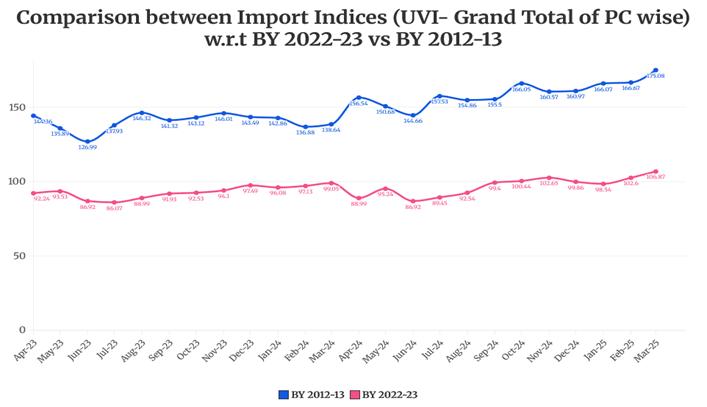
#BY means Base Year.
| Table: Unit Value Index (UVI) and Quantity Index (QI) during FY 2025-26(Apr-Nov) using FY 2022-23 as base year | |||||||||||
|
| Month | Apr_25 | May_25 | Jun_25 | 1st Qtr 25-26 | Jul_25 | Aug_25 | Sep_25 | 2nd Qtr 25-26 | Oct_25 | Nov_25 |
| Unit Value Index | Export | 105.31 | 99.73 | 96.31 | 100.33 | 99.31 | 100.55 | 104.08 | 101.23 | 103.78 | 105.32 |
| Import | 92.33 | 97.97 | 91.74 | 94.08 | 96.34 | 100.81 | 108.69 | 101.93 | 110.17 | 106.59 | |
| Quantity Index | Export | 107.85 | 104.76 | 93.88 | 101.91 | 103.41 | 102.64 | 111.04 | 105.57 | 116.19 | 113.06 |
| Import | 138.16 | 126.61 | 112.58 | 125.17 | 122.47 | 124.06 | 126.45 | 124.32 | 137.04 | 121.75 | |
* Qtr means Quarter.
Meaning and interpretation of the Indices
The Unit Value Indices and the Quantity Indices may be interpreted along the following lines.
The Unit Value Index answers the question: What is the growth in the average Unit Value of the items1 traded in the current month with respect to the same month in the Base Year?
So, an Unit Value Index of, say, 120 means that if the items that have been traded in the current month had been traded in the same month of the base year, and if the average price (or unit value) of those items had been Rs.100 in that month of the base year, then the average price (or unit value) of these items in the current month is Rs.120. Or that, there is a 20% increase in the average Unit Value, with respect to the Base Year, of the items that have been traded in the Current Month.
For example, let us suppose 30 items, 10 items each from 3 different Principal Commodities, have been traded in the current month. If these 30 items had been traded in the corresponding month of the base year at an average price of Rs.100, then the average price of these items in the current year is Rs.120.
It is to be noted that there are two successive steps of averaging done here. The first averaging is done over all the items (or ITCHS) of a PC group to arrive at the Index of that PC group. And the second averaging is done over all the PC groups to arrive at the Index at the Grand Total level for all commodities (which is the overall Index for India for a month). In both the stages, a weighted average is taken where the weights are proportional to the importance of the items and the PC groups respectively, and the Laspeyres Formula is used for averaging.
Quantity Indices, say, 200 means that if in the base year on an average 100 units were traded in India in the base year, then in the current year on an average 200 units were traded. However, it must be remembered that averaging quantities are different from averaging prices, since quantities in different units cannot be added directly.
So, the Quantity Indices are calculated by dividing the Value Indices by the Unit Value Indices. For example, if there is an increase in the Value of Export from Rs. 10,000 to Rs. 24,000, then the Value Index is 24000/10000 × 100 = 240. If the Unit Value Index is 120, then the Quantity Index comes to 240/120 × 100 = 200. So, loosely it can be said that, if the value of export has increased 2.4 times and the price of the commodities has increased 1.2 times, then the quantity must have doubled.
However, it may be noted that a very high or low Quantity Index may indicate the presence of Base Effect.
The Interpretation of the Bilateral and Regional Indices can be seen as an extension of the above.
A Unit Value Index of 120 with respect to a country, say Bangladesh, means that if all the items that have been traded with Bangladesh in the current month had been traded in the same month of the base year with the same country, and if the average price (or unit value) of those items had been Rs.100 in that month of the base year, then the average price (or unit value) of these items in the current month is Rs.120.
Similarly, a Quantity Index of 200 with respect to a country, say Bangladesh, means that if in the base year on an average 100 units were traded in India in the base year, then in the current year on an average 200 units were traded.
Comparability of the Indices across time
It is to be noted that the weights in the Index Number formula are fixed across time and there are twelve sets of weights for the twelve months. Hence, comparability of Indices is meaningful only when Indices of same month are compared across years. Different months may attach different weights to the same item, and hence comparing indices of two different months becomes vague and may have little applicability.
Further, the weights of the items that are not present in the trade basket of the current month are distributed to all the items that have been traded in the current month. This distribution is done in proportion to the weights of those items.
For example, let us suppose there are only 3 commodities for trade, say A, B and C. In month May of the Base year, let us suppose that the trade value of A was Rs. 50, B was Rs. 100 and C was Rs. 50. Then the weights assigned to A, B and C in the month of May of the following years would be in the ratio 50 :100 :50. However, in case, C is not traded in the current month, then the weight of C would be distributed proportionately among A and B, again in the ratio 1:2 (since in May the weights of A and B are in the ratio of 50 : 100, i.e., 1 : 2). So, in the current month the weights of A and B would be 3313 and 6623 .
As a result, the weights in any two given months are dependent on exactly the number of items (ITCHS codes) traded in those months. If the items traded are widely different, inference drawn from the comparison of the Indices may be done accordingly. On the other hand, more the similarity in the number of items traded more is the comparability of the two indices.
Net Terms of Trade:
Net Terms of Trade also called commodity Terms of Trade is defined as a ratio of export prices to import prices.
Let say 2022-23 be the base year and 2023-24 be the final year. We express both export and import prices in 2022-23 as 100. Now, suppose that at the end of 2023-24, it is found that the index of export prices decreased to 90 and index of import prices roses to 150. Then the Net Terms of Trade has changed to 90100150100=35 . Then terms of trade as index=35*100=60 . It implies that terms of trade of the country have decreased by about 40% in 2023-24 as compared with 2022-23. It thus shows a deterioration or a worsening of the terms of trade of the country.
If the index of export prices has risen to 150 and that of import prices had risen to 120, then the net terms of trade would have changed to 150120*100=125 . This implies an improvement in the net terms of trade of the country by 25% in 2023-24 over 2022-23.
Gross Terms of Trade:
Gross Terms of Trade is the ratio of physicalquantity of import to physical quantity of export.
Let say 2022-23 be the base year. In that year, the quantities export and import are denoted by 100. Now, suppose that in the year 2023-24, the index of quantity of import was 150 and that of quantity of export was 120. Then the gross terms of trade is given by 150100120100=54, in terms of percentage =54*100=125 . This implies that there was an improvement of gross terms of trade by 25% in 2023-24 compared to 2022-23.
Income Terms of Trade: Income Terms of Trade is defined as- Net Terms of Trade multiplied by quantity of export.

