

Loading...

Top
Help
×

By creating an account you can:

Logo TaxTMI
Call Us / Help / Feedback

Contact Us At :

E-mail: [email protected]

Call / WhatsApp at: +91 99117 96707

For more information, Check Contact Us

FAQs :

To know Frequently Asked Questions, Check FAQs

Most Asked Video Tutorials :

For more tutorials, Check Video Tutorials

Submit Feedback/Suggestion :

Email :
Please provide your email address so we can follow up on your feedback.
Category :
Description :
Min 15 characters 0/2000
Make Most of Text Search
  1. Checkout this video tutorial: How to search effectively on TaxTMI.
  2. Put words in double quotes for exact word search, eg: "income tax"
  3. Avoid noise words such as : 'and, of, the, a'
  4. Sort by Relevance to get the most relevant document.
  5. Press Enter to add multiple terms/multiple phrases, and then click on Search to Search.
  6. Text Search
  7. The system will try to fetch results that contains ALL your words.
  8. Once you add keywords, you'll see a new 'Search In' filter that makes your results even more precise.
  9. Text Search
Add to...
You have not created any category. Kindly create one to bookmark this item!
Create New Category
Hide
Title :
Description :
❮❮ Hide
Default View
Expand ❯❯
Close ✕
🔎 News - Adv. Search
TEXT SEARCH:

Press 'Enter' to add multiple search terms. Rules for Better Search

Search In:
Main Text + AI Text
  • Main Text
  • Main Text + AI Text
  • AI Text
Category: ?
Categorized by AI
---- All Categories ----
  • ---- All Categories ----
  • Income Tax
  • GST
  • Customs, DGFT & SEZ
  • FEMA & RBI
  • Corp. Laws, SEBI & IBC
  • PMLA, Black Money & ED
  • Budget
  • News and Press Release
  • PTI News
Month:
---- All Months ----
  • ---- All Months ----
  • January
  • February
  • March
  • April
  • May
  • June
  • July
  • August
  • September
  • October
  • November
  • December
Year:
---- All Years ----
  • ---- All Years ----
  • 2026
  • 2025
  • 2024
  • 2023
  • 2022
  • 2021
  • 2020
  • 2019
  • 2018
  • 2017
  • 2016
  • 2015
  • 2014
  • 2013
  • 2012
  • 2011
Sort By: ?
In Sort By 'Default', exact matches for text search are shown at the top, followed by the remaining results in their regular order.
Relevance Default Date
    Jamshedpur man among crew of LPG vessel back from West Asia, family heaves sigh of relief
    CCI Organises 11th Edition of National Conference on Economics of Competition Law
    The cumulative exports (merchandise & services) during April-February 2025-26 is estimated at US$ 790.86 Billion, as compared to US$ 747.58 Billion in...
    Rupee gains 2 paise to 92.28 against US dollar
    LPG supply: Oppn raises issue in Parliament; crackdown on hoarding in multiple states
    Telangana's GSDP for 2025-26 stands at Rs 17.82 lakh cr: Governor Shiv Pratap Shukla
    Shrapnel from Iranian missile barrage falls near Church of Holy Sepulchre in Jerusalem
    Opposition slams govt on West Asia crisis; warns of trade, jobs and energy fallout
    China warns Trump's latest tariff moves could damage trade ties
    West Asia conflict hits export of Bundi Basmati as rice worth Rs 300 cr stuck at ports, say millers
    EU, India focus on implementing FTA, defence deal: von der Leyen
    Indian oil tanker to arrive Tuesday after sailing from attacked UAE port
    Coordinated Efforts of Government, RBI and NPCI Accelerate Growth in Digital Payments
    Government Strengthens Financial Inclusion Ecosystem Through Flagship Schemes
    Tripura CM declares 5 pc DA hike for govt employees
    India's exports to US fall 13 pc in Feb; trade gap with China crosses USD 100 bn
    City gas firms push piped cooking gas with incentives amid LPG supply worries
    Exports dip marginally in Feb; trade gap narrows
    Advisory regarding confirmation of “Tax Liability Breakup, As Applicable” in GSTR-3B
    Wholesale price inflation at 11-month high of 2.13 pc; higher crude prices to push WPI higher
❯❯
Maximize Maximize Maximize
0 / 200
Expand Note
Add to Folder

No Folders have been created

+

Are you sure you want to delete "My most important" ?

NOTE:

News
Showing Results for :
Reset Filters
Results Found:
Show All Summaries Hide All Summaries
March 17, 2026
Show AI Summary
Safe maritime passage secured through diplomacy enabled LPG carriers to transit the Strait of Hormuz and reach Indian ports.
Negotiations between Indian authorities and Iranian counterparts secured safe passage for Indian-flagged LPG vessels through the Strait of Hormuz amid conflict, enabling the Shivalik and Nanda Devi to transit from the west side of the strait and proceed to Indian ports. Vessels maintained standoff distances until receiving clearance from headquarters; cargo discharge was allocated across Mundra and Mangaluru with the other vessel expected at Kandla. The incident is set against India's significant dependence on West Asian energy supplies and the blockade-related stranding of multiple ships.
March 17, 2026
Show AI Summary
Competition law: adapt enforcement and regulation for digital markets and AI to prevent ecosystem entrenchment and ensure interoperability.
The Conference emphasised the central role of competition law and economics in preventing concentration and exclusion, identifying four institutional pillars-contestability, information symmetry, non discriminatory infrastructure access, and independent enforcement-and called for adaptation of the competition toolkit for digital markets and AI to prevent ecosystem entrenchment and ensure data portability and interoperability. It noted regulatory steps including operationalising 2023 amendments, a revised cost of production regulation for predatory pricing, a proactive approach to combinations, use of a settlement mechanism, and a market study plus guidance on AI risks and self audit measures.
March 17, 2026
Show AI Summary
Trade Growth: combined exports rising with widening import-driven deficit as services surplus offsets merchandise shortfall.
Combined merchandise and services exports for April-February 2025-26 are estimated at US$ 790.86 billion, up from US$ 747.58 billion, while combined imports are estimated at US$ 900.51 billion, producing a widened trade deficit. Merchandise exports rose modestly to US$ 402.93 billion against imports of US$ 713.53 billion, increasing the merchandise deficit. Services exports of US$ 387.93 billion and services imports of US$ 186.98 billion generate a sizeable services surplus that partially offsets the merchandise shortfall.
March 16, 2026
Show AI Summary
Foreign exchange intervention stabilisation: RBI action counters pressures from crude-led trade shock and capital outflows.
The rupee strengthened marginally as equity gains and a softer US dollar offset pressures from rising crude prices and foreign outflows; analysts cited elevated oil import demand widening the trade deficit and placed part of the currency stabilisation on foreign exchange intervention by the Reserve Bank, with near term exchange rate direction to be influenced by global central bank decisions, US data, energy prices, and portfolio flows.
March 16, 2026
Show AI Summary
Hoarding enforcement intensifies to curb illegal LPG stockpiling and stabilise supplies amid import-route disruptions.
State and local authorities increased enforcement against illegal LPG stockpiling and black marketing, conducting coordinated raids and inspections, registering cases under the Essential Commodities Act, seizing cylinders and detaining suspects, while governments and petroleum entities emphasised coordination among enforcement, distributors and oil-marketing companies and rolled out incentives to shift consumers from LPG to piped natural gas to stabilise supplies amid import-route disruptions.
March 16, 2026
Show AI Summary
CURE Act statutory framework proposed to unify agencies and guide Telangana's urban development and economic transformation.
The state advances a spatially differentiated development strategy under the CURE-PURE-RARE framework and proposes a statutory governance structure through the CURE Act to replace the existing municipal framework, unify multiple agencies, and coordinate urban planning and infrastructure delivery to realise the Telangana Rising Vision 2047 and interim economic targets.
March 16, 2026
Show AI Summary
Freedom of navigation: attacks on shipping and chokepoint security disrupt energy transit and prompt military protection measures.
Cross-border strikes and missile/drone barrages have produced damage to religious and civilian sites and disrupted maritime transit through the Strait of Hormuz, prompting military measures to protect freedom of navigation. The conflict has caused energy-market volatility and operational responses including alternative export routing and calls for allied naval presence. Incidents involving non state armed groups have prompted government statements prohibiting unauthorized armed activity and raised displacement and peacekeeping protection issues.
March 16, 2026
Show AI Summary
Energy and trade security risks may disrupt exports and rural employment, prompting calls for contingency fiscal measures.
Parliamentary debate on the Appropriation Bill warned that the West Asia conflict and strained ties could disrupt Gulf trade routes, reduce exports, and displace millions of rural and semi urban workers, urging contingency plans for returning workers and protection of dependent families. The discussion flagged supply risks to LPG and fertilisers due to import dependence, noted a supplementary demand for additional nutrient based subsidy allocation, and criticised replacement livelihood frameworks for weakening existing employment guarantees, calling for targeted fiscal measures and timely notification of support schemes.
March 16, 2026
Show AI Summary
Trade investigations risk harming bilateral economic relations as tariff measures prompt diplomatic concern ahead of planned visit.
China warned that US trade investigations into foreign manufacturing, launched after the US Supreme Court struck down earlier tariffs, could interfere with or damage bilateral economic and trade relations, and conveyed serious concern that investigation outcomes and subsequent tariff actions might undermine recently stabilised China-US economic ties reached after a prior tariff war and truce.
March 16, 2026
Show AI Summary
War risk insurance denial halts rice exports, prompting calls for emergency relief to sustain mills and protect workers.
The West Asia conflict has caused export holds and storage backlogs for Bundi-Kota Basmati rice, with shipping companies denied war risk insurance and imposing steep surcharges, depressing local prices and creating storage and employment risks; millers request special government concessions and a targeted relief package to sustain production and protect workers.
March 16, 2026
Show AI Summary
Free Trade Agreement implementation advances, coupled with Security and Defence Partnership to prioritise efficient delivery and regional stability.
The EU and India are concentrating on operationalising the recently concluded Free Trade Agreement and the signed Security and Defence Partnership, prioritising efficient implementation to deliver benefits to both populations; discussions also identified de escalation, stability and energy security as shared objectives while advancing practical trade measures and defence cooperation.
March 16, 2026
Show AI Summary
Safe passage of Indian-flagged vessels ensured amid Strait of Hormuz disruptions through coordinated maritime measures and port relief.
Indian-flagged vessels faced disruption after an attack on the Fujairah oil terminal; the tanker Jag Laadki sailed safely from Fujairah and is due at Mundra. A DG Shipping Control Room and an inter-ministerial group are coordinating with ports and Customs to monitor movements, repatriate crew, and ensure seafarer welfare. Ports have offered operational and commercial relief-priority discharge, concessions on anchorage, berth hire and storage, temporary transshipment storage, and rebates on reefer plug-in charges-to maintain continuity of crude, gas and LPG supply chains and maritime trade.
March 16, 2026
Show AI Summary
Digital payments governance reinforces technical safeguards and reporting avenues, enhancing adoption while addressing fraud and inclusion challenges.
Unified Payments Interface drives the majority of retail digital transactions, underpinned by incentives, interoperability and inclusion measures, while technical and procedural safeguards - including device binding, two factor authentication, transaction limits and AI/ML fraud monitoring - together with awareness campaigns and national reporting platforms, form the framework for fraud mitigation and secure adoption across urban and rural users.
March 16, 2026
Show AI Summary
Financial inclusion expanded through flagship schemes broadening access to banking, insurance, pensions and credit for underserved groups.
The central effort advances financial inclusion via flagship schemes that expand access to banking, insurance, pensions and collateral free credit for underserved households and micro enterprises, leveraging the JAM (Jan Dhan Aadhaar Mobile) digital pipeline to deliver welfare benefits through Direct Benefit Transfer.
March 16, 2026
Show AI Summary
Dearness allowance increase raises state allowance level effective April for government employees and pensioners with fiscal implications.
Tripura raised state dearness allowance to 41 per cent for government employees and pensioners, effective April 1, covering 1,02,563 regular employees and 81,019 pensioners, with an estimated additional recurring annual cost of about Rs 500 crore; the move aims to narrow the gap with central DA levels and was announced by the Chief Minister immediately after the finance minister's budget speech.
March 16, 2026
Show AI Summary
Tariff measures on Indian goods altered bilateral flows, reducing exports to the US while imports and trade deficits expanded.
India's merchandise exports to the United States contracted in February amid elevated US tariff measures on Indian goods, while US imports into India rose; a subsequent change in US duties is expected to affect future monthly data. Over the 11-month fiscal period, imports from China surged faster than exports, driving a substantial bilateral trade deficit. The notice also records country-specific import and export movements, including a marked increase in imports from Switzerland driven by gold.
March 16, 2026
Show AI Summary
Promotion of piped natural gas to relieve LPG supply pressure, with regulatory guidance and incentives to switch.
City gas distributors and the petroleum ministry are promoting conversion from LPG to piped natural gas through incentives and regulator guidance; CGD companies are to deploy additional resources and expedite connections via customer portals, call centres or other channels where pipelines exist, while the ministry urges online bookings, voluntary surrender of LPG where consumers have PNG, and state enforcement against hoarding and black marketing to manage LPG supply pressure.
March 16, 2026
Show AI Summary
Trade Balance narrows as merchandise exports dip amid geopolitical disruptions and surge in gold imports, now affecting shipments.
Merchandise exports declined 0.81% to USD 36.61 billion in February while the trade deficit narrowed to USD 27.1 billion month on month. Imports rose sharply-led by gold, silver, and oil-contributing to a wider year on year gap. Geopolitical conflict in West Asia has disrupted maritime and air logistics, raising freight and insurance costs and expected to suppress March exports. The government is consulting exporters to mitigate impacts, and a prospective bilateral trade pact awaits a new tariff architecture.
March 16, 2026
Show AI Summary
Tax Liability Breakup confirmation required in GSTR 3B: confirm or edit auto populated breakup to proceed with filing.
From February 2026 the portal auto populates the Tax Liability Breakup in GSTR 3B for supplies dated to previous tax periods when tax is paid in the current period; taxpayers must open the payment page tab, confirm or edit and save that breakup after offsetting liability, and only then proceed with filing using EVC or DSC, with the current confirmation requirement being applied in all cases pending portal resolution.
March 16, 2026
Show AI Summary
Wholesale price inflation set to rise as crude oil surge pushes wholesale costs higher, affecting manufacturing and non-food goods.
Wholesale price inflation rose to 2.13% in February 2026, led by higher prices in food and non-food articles and an uptick in manufactured goods; fuel and power deflation narrowed as global oil prices increased. Analysts warn that persistent crude oil price rises from geopolitical conflict will transmit more to WPI than retail CPI, likely pushing wholesale inflation higher in subsequent months. The report identifies basic metals, textiles and other manufacturing segments as contributors and stresses supply-chain, logistics and domestic manufacturing measures to contain cost-push pressures.

News

Back

All News

Showing Results for :
Reset Filters
No Records Found

News

Back

All News

Showing Results for : Reset Filters
Customs, DGFT & SEZ

Directorate General of Commercial Intelligence and Statistics Revises Base Year of Merchandise Trade Indices to FY 2022–23 to Reflect Current Trade Structure and Global Patterns

February 21, 2026

Contents
Summary
Note

Note

-

Bookmark

Print

Print

Merchandise Trade Indices are compiled and published by the Directorate General of Commercial Intelligence and Statistics (DGCI&S), Ministry of Commerce & Industry, to measure changes in the unit values (prices) of India’s exports and imports over time. These indices serve as important indicators of external sector price movements and are widely used for economic analysis, including national accounts compilation and assessment of terms of trade. Over the years, the base year of the indices has been periodically revised to reflect structural changes in India’s trade composition and evolving global trade patterns. The most recent revision updates the base year to FY 2022–23 (2022–23 = 100), replacing the earlier base of FY 2012–13, thereby ensuring that the indices accurately represent the current structure of India’s merchandise trade.

Revision of Base Year of India’s Merchandise Trade Indices to FY 2022–23

The Directorate General of Commercial Intelligence and Statistics (DGCI&S), Ministry of Commerce & Industry, has revised the base year of India’s Merchandise Trade Indices from FY 2012–13 to FY 2022–23 (2022–23 = 100), in view of the structural changes in the economy, shifts in commodity composition, evolving trade patterns, and the need for improved alignment with contemporary macroeconomic indicators.

The revision has been undertaken on the recommendations of a committee constituted by DGCI&S under the Chairmanship of Prof. Nachiketa Chattopadhyay, Professor, Indian Statistical Institute, Kolkata. The Committee examined the existing methodology, data coverage, weighting structure, and compilation practices, and recommended suitable refinements in line with international best practices.

Key Features of the Revised Series (Base: FY 2022–23)

  1. Updated Base Year:
    The new base year FY 2022–23 makes the Indices reflect the current structure of India’s external trade more accurately.
  2. Revised Commodity Basket:
    The coverage and classification of commodities have been reviewed at the Principal Commodity level to better capture emerging and declining trade items.
  3. Revised Weighting Structure:
    Weights have been updated based on trade values of the new base year to reflect the latest value shares in exports and imports.
  4. Improved Methodology:
    Methodological refinements have been introduced in:
    1. Selection of common commodity basket for base year selection (procedure of selection for common commodity basket explained in detail report of the committee).
    2. Treatment of missing unit values (Imputation of missing unit values in base year selection have been explained in detail in the committee report).
  5. Indices Compiled:
    The revised series includes:
    1. Monthly, Quarterly and Annual Indices (Export Unit Value Index,Import Unit Value Index).
    2. Principal Commodity (PC) Classification wise Trade Indices (Export/Import).
    3. Standard International Trade Classification-wise (SITC) Trade Indices.
    4. Broad economic categories-wise (BEC) Trade Indices.
    5. Bilateral and Region-wise Trade Indices of Top 20 Export and Import partner nations of India.
    6. Terms of Trade (Gross terms of trade, Net terms of trade and Income terms of trade).

Rationale for Revision

Over the past decade, India’s trade basket has undergone substantial changes due to emergence of new commodities, technological advancements, Global supply chain restructuring and changes in relative price structures.

The earlier base year (FY 2012–13) no longer adequately reflected the prevailing trade structure. The revision ensures improved relevance, reliability, and analytical usefulness of the Merchandise Trade Indices for policymakers, researchers, and other stakeholders.

Use of the Revised Series

Merchandise Trade Indices compiled by the Directorate General of Commercial Intelligence and Statistics (DGCI&S) are extensively used by key government institutions for economic analysis and policy formulation. The National Accounts Division (NAD) of the Ministry of Statistics and Programme Implementation uses the Export and Import Unit Value Indices as deflators for estimating real exports and imports in GDP compilation. The Reserve Bank of India (RBI) relies on these indices for external sector assessment, balance of payments analysis, and evaluation of price competitiveness. Various Ministries and Government agencies also use them to frame and review trade-related policies and to assess movements in international prices. In addition, academic institutions, research organizations, and economic analysts utilize Merchandise Trade Indices for empirical research, modelling, and analysis of trade dynamics and terms of trade trendson and economic research.

Availability of Data

The revised Merchandise Trade Indices (Base: FY 2022–23) will be released on the official website of DGCI&S. Detailed methodological documentation is available in the Report of the Committee on Revision of Base Year for Merchandise Trade Indices.

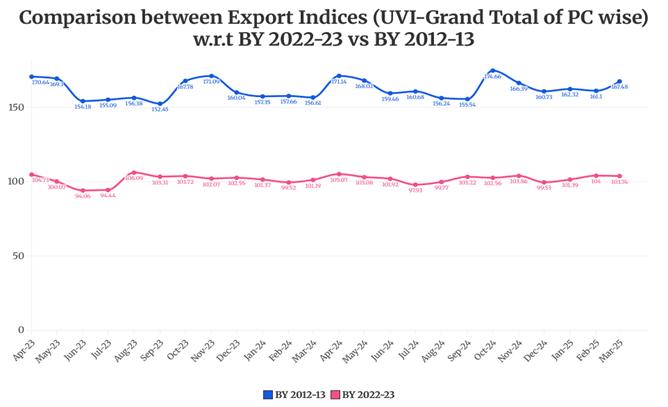
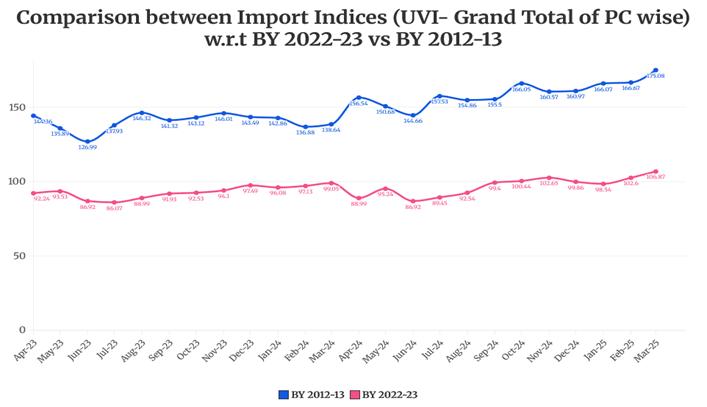
Comparison of the new revised Indices (Base Year: 2022-23) with the already released Indices (Base Year : 2012-13) for 2022-23 and 2023-24 is given below.
#BY means Base Year.
 

#BY means Base Year.

Table: Unit Value Index (UVI) and Quantity Index (QI) during FY 2025-26(Apr-Nov) using FY 2022-23 as base year


Month

Apr_25

May_25

Jun_25

1st Qtr 25-26

Jul_25

Aug_25

Sep_25

2nd Qtr 25-26

Oct_25

Nov_25

Unit Value Index

Export

105.31

99.73

96.31

100.33

99.31

100.55

104.08

101.23

103.78

105.32

Import

92.33

97.97

91.74

94.08

96.34

100.81

108.69

101.93

110.17

106.59

Quantity Index

Export

107.85

104.76

93.88

101.91

103.41

102.64

111.04

105.57

116.19

113.06

Import

138.16

126.61

112.58

125.17

122.47

124.06

126.45

124.32

137.04

121.75

Qtr  means Quarter.

Meaning and interpretation of the Indices

The Unit Value Indices and the Quantity Indices may be interpreted along the following lines.

The Unit Value Index answers the question: What is the growth in the average Unit Value of the items1 traded in the current month with respect to the same month in the Base Year?

So, an Unit Value Index of, say, 120 means that if the items that have been traded in the current month had been traded in the same month of the base year, and if the average price (or unit value) of those items had been Rs.100 in that month of the base year, then the average price (or unit value) of these items in the current month is Rs.120. Or that, there is a 20% increase in the average Unit Value, with respect to the Base Year, of the items that have been traded in the Current Month.

For example, let us suppose 30 items, 10 items each from 3 different Principal Commodities, have been traded in the current month. If these 30 items had been traded in the corresponding month of the base year at an average price of Rs.100, then the average price of these items in the current year is Rs.120.

It is to be noted that there are two successive steps of averaging done here. The first averaging is done over all the items (or ITCHS) of a PC group to arrive at the Index of that PC group. And the second averaging is done over all the PC groups to arrive at the Index at the Grand Total level for all commodities (which is the overall Index for India for a month). In both the stages, a weighted average is taken where the weights are proportional to the importance of the items and the PC groups respectively, and the Laspeyres Formula is used for averaging.

Quantity Indices, say, 200 means that if in the base year on an average 100 units were traded in India in the base year, then in the current year on an average 200 units were traded. However, it must be remembered that averaging quantities are different from averaging prices, since quantities in different units cannot be added directly.

So, the Quantity Indices are calculated by dividing the Value Indices by the Unit Value Indices. For example, if there is an increase in the Value of Export from Rs. 10,000 to Rs. 24,000, then the Value Index is 24000/10000 × 100 = 240. If the Unit Value Index is 120, then the Quantity Index comes to 240/120 × 100 = 200. So, loosely it can be said that, if the value of export has increased 2.4 times and the price of the commodities has increased 1.2 times, then the quantity must have doubled.

However, it may be noted that a very high or low Quantity Index may indicate the presence of Base Effect.

The Interpretation of the Bilateral and Regional Indices can be seen as an extension of the above.

A Unit Value Index of 120 with respect to a country, say Bangladesh, means that if all the items that have been traded with Bangladesh in the current month had been traded in the same month of the base year with the same country, and if the average price (or unit value) of those items had been Rs.100 in that month of the base year, then the average price (or unit value) of these items in the current month is Rs.120.

Similarly, a Quantity Index of 200 with respect to a country, say Bangladesh, means that if in the base year on an average 100 units were traded in India in the base year, then in the current year on an average 200 units were traded.

Comparability of the Indices across time

It is to be noted that the weights in the Index Number formula are fixed across time and there are twelve sets of weights for the twelve months. Hence, comparability of Indices is meaningful only when Indices of same month are compared across years. Different months may attach different weights to the same item, and hence comparing indices of two different months becomes vague and may have little applicability.

Further, the weights of the items that are not present in the trade basket of the current month are distributed to all the items that have been traded in the current month. This distribution is done in proportion to the weights of those items.

For example, let us suppose there are only 3 commodities for trade, say A, B and C. In month May of the Base year, let us suppose that the trade value of A was Rs. 50, B was Rs. 100 and C was Rs. 50. Then the weights assigned to A, B and C in the month of May of the following years would be in the ratio 50 :100 :50. However, in case, C is not traded in the current month, then the weight of C would be distributed proportionately among A and B, again in the ratio 1:2 (since in May the weights of A and B are in the ratio of 50 : 100, i.e., 1 : 2). So, in the current month the weights of A and B would be 3313  and 6623 .

As a result, the weights in any two given months are dependent on exactly the number of items (ITCHS codes) traded in those months. If the items traded are widely different, inference drawn from the comparison of the Indices may be done accordingly. On the other hand, more the similarity in the number of items traded more is the comparability of the two indices.

Net Terms of Trade:

Net Terms of Trade also called commodity Terms of Trade is defined as a ratio of export prices to import prices.

Let say 2022-23 be the base year and 2023-24 be the final year. We express both export and import prices in 2022-23 as 100. Now, suppose that at the end of 2023-24, it is found that the index of export prices decreased to 90 and index of import prices roses to 150. Then the Net Terms of Trade has changed to 90100150100=35 . Then terms of trade as index=35*100=60 . It implies that terms of trade of the country have decreased by about 40% in 2023-24 as compared with 2022-23. It thus shows a deterioration or a worsening of the terms of trade of the country.

If the index of export prices has risen to 150 and that of import prices had risen to 120, then the net terms of trade would have changed to 150120*100=125 . This implies an improvement in the net terms of trade of the country by 25% in 2023-24 over 2022-23.

Gross Terms of Trade:

Gross Terms of Trade is the ratio of physicalquantity of import to physical quantity of export.

Let say 2022-23 be the base year. In that year, the quantities export and import are denoted by 100. Now, suppose that in the year 2023-24, the index of quantity of import was 150 and that of quantity of export was 120. Then the gross terms of trade is given by 150100120100=54,  in terms of percentage =54*100=125 . This implies that there was an improvement of gross terms of trade by 25% in 2023-24 compared to 2022-23.

Income Terms of Trade: Income Terms of Trade is defined as- Net Terms of Trade multiplied by quantity of export.

Topics

Acts Income Tax