

Just a moment...

Top
Help
×

By creating an account you can:

Logo TaxTMI
>
Call Us / Help / Feedback

Contact Us At :

E-mail: [email protected]

Call / WhatsApp at: +91 99117 96707

For more information, Check Contact Us

FAQs :

To know Frequently Asked Questions, Check FAQs

Most Asked Video Tutorials :

For more tutorials, Check Video Tutorials

Submit Feedback/Suggestion :

Email :
Please provide your email address so we can follow up on your feedback.
Category :
Description :
Min 15 characters0/2000
Make Most of Text Search
  1. Checkout this video tutorial: How to search effectively on TaxTMI.
  2. Put words in double quotes for exact word search, eg: "income tax"
  3. Avoid noise words such as : 'and, of, the, a'
  4. Sort by Relevance to get the most relevant document.
  5. Press Enter to add multiple terms/multiple phrases, and then click on Search to Search.
  6. Text Search
  7. The system will try to fetch results that contains ALL your words.
  8. Once you add keywords, you'll see a new 'Search In' filter that makes your results even more precise.
  9. Text Search
Add to...
You have not created any category. Kindly create one to bookmark this item!
Create New Category
Hide
Title :
Description :
❮❮ Hide
Default View
Expand ❯❯
Close ✕
🔎 News - Adv. Search
TEXT SEARCH:

Press 'Enter' to add multiple search terms. Rules for Better Search

Search In:
Main Text + AI Text
  • Main Text
  • Main Text + AI Text
  • AI Text
Category: ?
Categorized by AI
---- All Categories ----
  • ---- All Categories ----
  • Income Tax
  • GST
  • Customs, DGFT & SEZ
  • FEMA & RBI
  • Corp. Laws, SEBI & IBC
  • PMLA, Black Money & ED
  • Budget
  • News and Press Release
  • PTI News
Month:
---- All Months ----
  • ---- All Months ----
  • January
  • February
  • March
  • April
  • May
  • June
  • July
  • August
  • September
  • October
  • November
  • December
Year:
---- All Years ----
  • ---- All Years ----
  • 2026
  • 2025
  • 2024
  • 2023
  • 2022
  • 2021
  • 2020
  • 2019
  • 2018
  • 2017
  • 2016
  • 2015
  • 2014
  • 2013
  • 2012
  • 2011
Sort By: ?
In Sort By 'Default', exact matches for text search are shown at the top, followed by the remaining results in their regular order.
RelevanceDefaultDate
    No Records Found
    ❯❯
    MaximizeMaximizeMaximize
    0 / 200
    Expand Note
    Add to Folder

    No Folders have been created

      +

      Are you sure you want to delete "My most important" ?

      NOTE:

      News
      Showing Results for :
      Reset Filters
      Results Found:
      AI TextQuick Glance by AIHeadnote
      Show All SummariesHide All Summaries
      No Records Found

      News

      Back

      All News

      Showing Results for :
      Reset Filters
      Showing
      Records
      ExpandCollapse
        No Records Found

        News

        Back

        All News

        whatsappJoin Channel
        Showing Results for : Reset Filters
        Case ID :
        Customs, DGFT & SEZ

        Total exports of merchandise and services in FY 2024-25 begins with strong growth of 6.88%; estimated at USD 64.56 Billion in April 2024 as compared to USD 60.40 Billion in April 2023

        May 15, 2024

        📋
        Contents
        Note

        Note

        -

        Bookmark

        print

        Print

        Login to TaxTMI
        Verification Pending

        The Email Id has not been verified. Click on the link we have sent on

        Didn't receive the mail? Resend Mail

        Don't have an account? Register Here

        Merchandise exports grow by 1.08% at USD 34.99 Billion in April 2024 as compared to USD 34.62 Billion in April 2023

        Non-petroleum & Non-Gems & Jewellery exports register an increase of 1.32% from USD 25.77 Billion in April 2023 to USD 26.11 Billion in April 2024

        Main drivers of merchandise exports growth during April 2024 include Electronic Goods, Organic & Inorganic Chemicals, Petroleum Products and Drugs & Pharmaceuticals

        Electronic goods exports increase by 25.8% from USD 2.11 Billion in April 2023 to USD 2.65 Billion in April 2024

        Exports of Organic and Inorganic Chemicals increase by 16.75% from USD 2.14 Billion in April 2023 to USD 2.50 Billion in April 2024

        Drugs and pharmaceuticals exports increase by 7.36% from USD 2.26 Billion in April 2023 to USD 2.43 Billion in April 2024

        Petroleum products exports up by 3.10% from USD 6.42 Billion in April 2023 to USD 6.62 Billion in April 2024

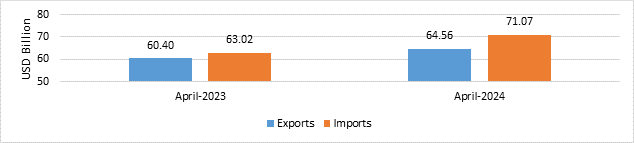
        • India’s total exports (Merchandise and Services combined) in April 2024* is estimated to be USD 64.56 Billion, exhibiting a positive growth of 6.88 per cent over April 2023. Total imports (Merchandise and Services combined) in April 2024* is estimated to be USD 71.07 Billion, exhibiting a positive growth of 12.78 per cent over April 2023.

        Table 1: Trade during April 2024*


        April 2024

        (USD Billion)

        April 2023

        (USD Billion)

        Merchandise

        Exports

        34.99

        34.62

        Imports

        54.09

        49.06

        Services*

        Exports

        29.57

        25.78

        Imports

        16.97

        13.96

        Total Trade

        (Merchandise +Services) *

        Exports

        64.56

        60.40

        Imports

        71.07

        63.02

        Trade Balance

        -6.51

        -2.62

        * Note: The latest data for services sector released by RBI is for March 2024. The data for April 2024 is an estimation, which will be revised based on RBI’s subsequent release.

        Fig 1: Total Trade during April 2024*
        MERCHANDISE TRADE

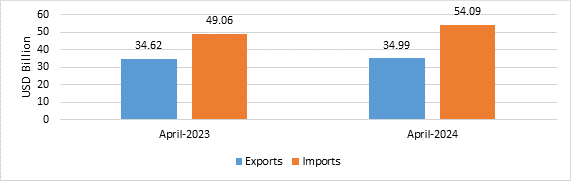
        • Merchandise exports in April 2024 were USD 34.99 Billion, as compared to USD 34.62 Billion in April 2023.
        • Merchandise imports in April 2024 were USD 54.09 Billion, as compared to USD 49.06 Billion in April 2023.

        Fig 2: Merchandise Trade during April 2024
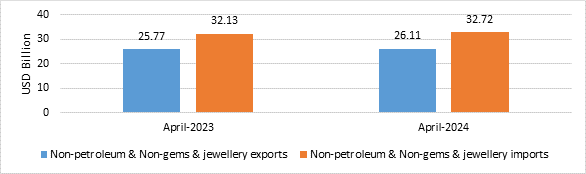
        • Non-petroleum and non-gems & jewellery exports in April 2024 were USD 26.11 Billion, compared to USD 25.77 Billion in April 2023.
        • Non-petroleum, non-gems & jewellery (gold, silver & precious metals) imports in April 2024 were USD 32.72 Billion, compared to USD 32.13 Billion in April 2023.

        Table 2: Trade excluding Petroleum and Gems & Jewellery during April 2024


        April 2024

        (USD Billion)

        April 2023

        (USD Billion)

        Non- petroleum exports

        28.37

        28.20

        Non- petroleum imports

        37.63

        35.36

        Non-petroleum & Non Gems & Jewellery exports

        26.11

        25.77

        Non-petroleum & Non Gems & Jewellery imports

        32.72

        32.13

        Note: Gems & Jewellery Imports include Gold, Silver & Pearls, precious & Semi-precious stones

        Fig 3: Trade excluding Petroleum and Gems & Jewellery during April 2024
        SERVICES TRADE
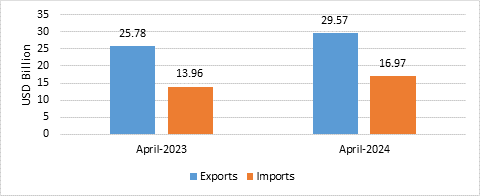
        • The estimated value of services export for April 2024* is USD 29.57 Billion, as compared to USD 25.78 Billion in April 2023.
        • The estimated value of services import for April 2024* is USD 16.97 Billion as compared to USD 13.96 Billion in April 2023.

        Fig 4: Services Trade during April 2024*
        • In merchandise exports, 13 of the 30 key sectors exhibited positive growth in April 2024 as compared to same period last year (April 2023). These include Electronic Goods (25.8%), Tea (25.74%), Organic & Inorganic Chemicals (16.75%), Coffee (15.87%), Tobacco (13.22%), Spices (12.27%), Drugs & Pharmaceuticals (7.36%), Cotton Yarn/Fabs./Made-Ups, Handloom Products etc. (6.65%), Carpet (5.64%), Cereal Preparations & Miscellaneous Processed Items (5.33%), Petroleum Products (3.1%), Plastic & Linoleum (2.99%) and Handicrafts Excl. Hand Made Carpet (2.36%).
        • In merchandise imports, 14 out of 30 key sectors exhibited negative growth in April 2024. These include Sulphur & Unroasted Iron Pyrites (-71.75%), Pearls, Precious & Semi-Precious Stones (-21.12%), Cotton Raw & Waste (-16.31%), Wood &  Wood Products (-14.11%), Coal, Coke & Briquettes, etc. (-11.71%), Artificial Resins, Plastic Materials, etc. (-10.26%), Fertilisers, Crude & Manufactured (-8.3%), Iron & Steel (-8.28%), Chemical Material & Products (-7.69%), Organic & Inorganic Chemicals (-5.19%), Machinery, Electrical & Non-Electrical (-3.54%), Dyeing/Tanning/Colouring Materials (-2.63%), Pulp and Waste Paper (-2.2%) and Transport Equipment (-0.22%).
        • Services exports is projected to grow by 14.68 percent during April 2024 over April 2023.

        *Link for Quick Estimates

        Export Growth signals stronger merchandise and services performance in April, widening the trade deficit as imports rose. Combined merchandise and services exports for April 2024 are estimated at USD 64.56 billion (6.88% growth year-on-year) while combined imports are estimated at USD 71.07 billion (12.78% growth), producing a larger trade deficit. Merchandise exports were USD 34.99 billion and merchandise imports USD 54.09 billion. Services exports are estimated at USD 29.57 billion and services imports at USD 16.97 billion; the services figures for April 2024 are provisional and subject to revision based on the RBI's subsequent release. Sectoral drivers include Electronic Goods, Chemicals and Pharmaceuticals, while multiple import sectors registered declines.
                          Cases where this provision is explicitly mentioned in the judgment/order text; may not be exhaustive. To view the complete list of cases mentioning this section, Click here.
                            Provisions expressly mentioned in the judgment/order text.

                                Export Growth signals stronger merchandise and services performance in April, widening the trade deficit as imports rose.

                                Combined merchandise and services exports for April 2024 are estimated at USD 64.56 billion (6.88% growth year-on-year) while combined imports are estimated at USD 71.07 billion (12.78% growth), producing a larger trade deficit. Merchandise exports were USD 34.99 billion and merchandise imports USD 54.09 billion. Services exports are estimated at USD 29.57 billion and services imports at USD 16.97 billion; the services figures for April 2024 are provisional and subject to revision based on the RBI's subsequent release. Sectoral drivers include Electronic Goods, Chemicals and Pharmaceuticals, while multiple import sectors registered declines.


                                Note: It is a system-generated summary and is for quick reference only.

                                Topics

                                ActsIncome Tax
                                No Records Found