 TaxTMI
 Login
 TaxTMI
Login
Loading...
Press 'Enter' to add multiple search terms. Rules for Better Search

Press 'Enter' after typing page number.
Press 'Enter' after typing page number.


No Folders have been created
Are you sure you want to delete "My most important" ?
NOTE:
Press 'Enter' after typing page number.
Press 'Enter' after typing page number.

All News
Press 'Enter' after typing page number.
All News

Note

Bookmark

Share


India’s overall exports in May 2023 stands at US$ 60.29 Billion
Electronic Goods export witnesses significant increase by 73.96 % in May 2023 as well as cumulatively in April-May 2023 by 48.06% over corresponding period last year
Agricultural exports register robust growth; Spices grew by 31.81% in April-May 2023 over April-May 2022 while Rice exports grew by 19% in April-May 2023 over April-May 2022
Oil Meals exports grew by 74.33% in April-May 2023 over April-May 2022
Ceramic products & glassware show impressive growth with 17.36% in May 2023 and cumulatively by 17.29 % in April-May 2023 over the corresponding period last year
Trade balance improves considerably in April-May 2023
Overall trade deficit for April-May 2023 estimated at US$ 13.28 Billion as compared to the deficit of US$ 20.56 Billion during April-May 2022, registering a decline of (-) 35.41 %
Merchandise trade deficit during April-May 2023 stands at US$ 37.26 Billion compared to US$ 40.48 Billion during April-May 2022, registering a decline of (-) 7.95 perce
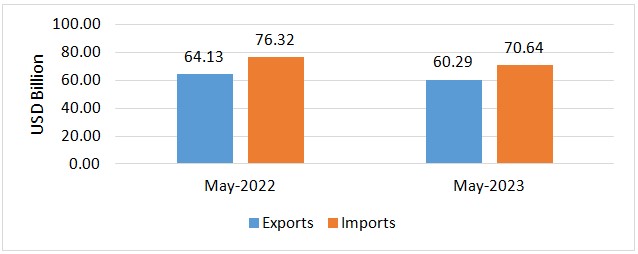
India’s overall exports (Merchandise and Services combined) in May 2023* is estimated to be USD 60.29 Billion, exhibiting a negative growth of (-) 5.99 per cent over May 2022. Overall imports in May 2023* is estimated to be USD 70.64 Billion, exhibiting a negative growth of (-) 7.45 per cent over May 2022.
Table 1: Trade during May 2023*
|
| May 2023 (USD Billion) | May 2022 (USD Billion) | |
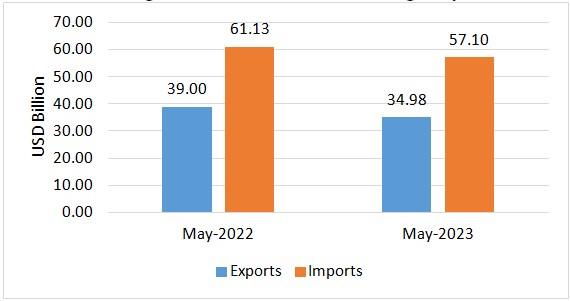
| Merchandise | Exports | 34.98 | 39.00 |
| Imports | 57.10 | 61.13 | |
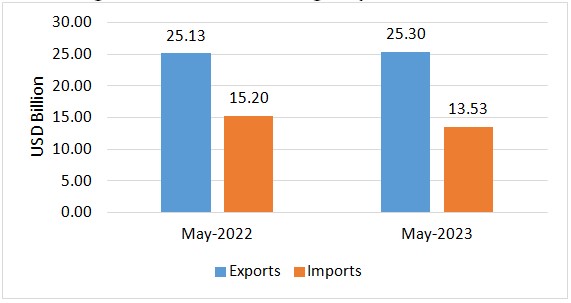
| Services* | Exports | 25.30 | 25.13 |
| Imports | 13.53 | 15.20 | |
| Overall Trade (Merchandise +Services) * | Exports | 60.29 | 64.13 |
| Imports | 70.64 | 76.32 | |
| Trade Balance | -10.35 | -12.20 |
* Note: The latest data for services sector released by RBI is for April 2023. The data for May 2023 is an estimation, which will be revised based on RBI’s subsequent release. (ii) Data for April-May 2022 has been revised on pro-rata basis using quarterly balance of payments data
Fig 1: Overall Trade during May 2023*
India’s overall exports (Merchandise and Services combined) in April-May 2023 is estimated to exhibit a negative growth of (-) 5.48 per cent over April-May 2022. Overall imports in April-May 2023 is estimated to exhibit a negative growth of (-) 9.63 per cent over April-May 2022.
Table 2: Trade during April-May 2023*
|
|
| April-May 2023 (USD Billion) | April-May 2022 (USD Billion) |
| Merchandise | Exports | 69.72 | 78.70 |
| Imports | 106.99 | 119.18 | |
| Services* | Exports | 51.14 | 49.17 |
| Imports | 27.16 | 29.25 | |
| Overall Trade (Merchandise+Services) * | Exports | 120.87 | 127.88 |
| Imports | 134.15 | 148.44 | |
| Trade Balance | -13.28 | -20.56 |
Fig 2: Overall Trade during April-May 2023*
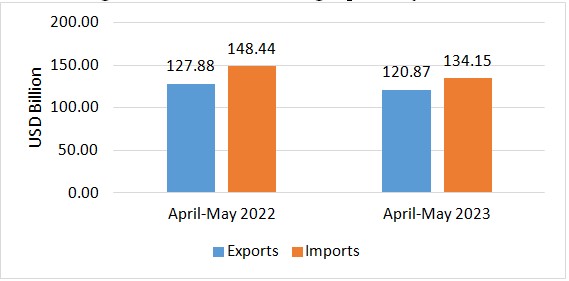
Fig 3: Merchandise Trade during May 2023
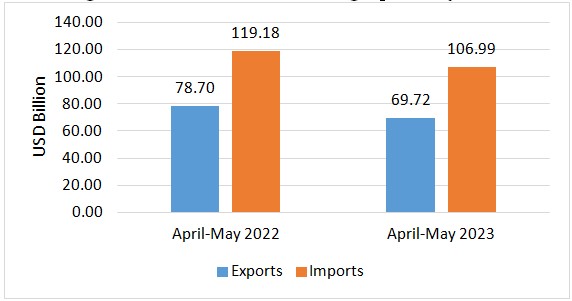
Merchandise exports for the period April-May 2023 were USD 69.72 Billion as against USD 78.70 Billion during April-May 2022.
Merchandise imports for the period April-May 2023 were USD 106.99 Billion as against USD 119.18 Billion during April-May 2022.
The merchandise trade deficit for April-May 2023 was estimated at USD 37.26 Billion as against USD 40.48 Billion during April-May 2022.
Fig 4: Merchandise Trade during April-May 2023
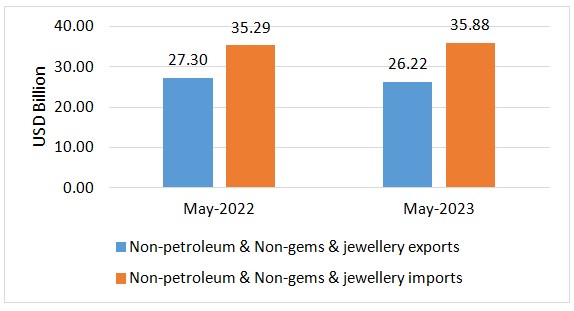
Non-petroleum and non-gems & jewellery exports in May 2023 were USD 26.22 Billion, compared to USD 27.30 Billion in May 2022.
Non-petroleum, non-gems & jewellery (gold, silver & precious metals) imports in May 2023 were USD 35.88 Billion, compared to USD 35.29 Billion in May 2022.
Table 3: Trade excluding Petroleum and Gems & Jewellery during May 2023
|
| May 2023 (USD Billion) | May 2022 (USD Billion) |
| Non- petroleum exports | 29.04 | 30.53 |
| Non- petroleum imports | 41.48 | 44.51 |
| Non-petroleum & Non Gems & Jewellery exports | 26.22 | 27.30 |
| Non-petroleum & Non Gems & Jewellery imports | 35.88 | 35.29 |
Note: Gems &Jewellery Imports include Gold, Silver & Pearls, precious & Semi-precious stones
Fig 5: Trade excluding Petroleum and Gems & Jewellery during May 2023
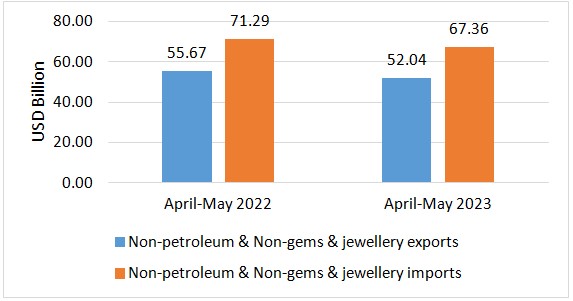
Non-petroleum and non-gems & jewellery exports during April-May 2023 was USD 52.04 Billion, as compared to USD 55.67 Billion in April-May 2022.
Non-petroleum, non-gems & jewellery (gold, silver & precious metals) imports were USD 67.36 Billion in April-May 2023 as compared to USD 71.29 Billion in April-May 2022.
Table 4: Trade excluding Petroleum and Gems & Jewellery during April-May 2023
|
| April-May 2023 (USD Billion) | April-May 2022 (USD Billion) |
| Non- petroleum exports | 57.29 | 62.37 |
| Non- petroleum imports | 76.19 | 84.94 |
| Non-petroleum & Non Gems & Jewellery exports | 52.04 | 55.67 |
| Non-petroleum & Non Gems & Jewellery imports | 67.36 | 71.29 |
Note: Gems &Jewellery Imports include Gold, Silver & Pearls, precious & Semi-precious stones
Fig 6: Trade excluding Petroleum and Gems & Jewellery during April-May 2023
SERVICES TRADE
Fig 7: Services Trade during May 2023*
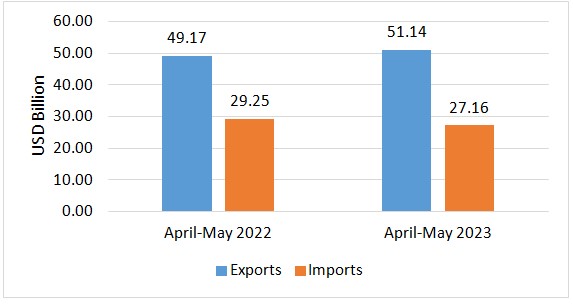
The estimated value of services export for April-May 2023* is USD 51.14 Billion as compared to USD 49.17 Billion in April-May 2022.
The estimated value of services imports for April-May 2023* is USD 27.16 Billion as compared to USD 29.25 Billion in April-May 2022.
The services trade surplus for April-May 2023* is estimated at USD 23.98 Billion as against USD 19.92 Billion in April-May 2022.
Fig 8: Services Trade during April-May 2023
India’s trade performance, after witnessing very strong growth in 2022-23 has shown declining trends as compared to high base of last year as the pace of growth in global merchandise exports moderated significantly in 2023, as persisting geopolitical tensions and monetary tightening induced recessionary fears have led to a decline in consumer spending across advanced nations.
For the month of May 2023, under merchandise exports, 13 of the 30 key sectors exhibited positive growth in May 2023 as compared to same period last year (May 2022). These include Electronic Goods (73.96%), Other Cereals (67.96%), Oil Meals (52.91%), Spices (49.84%), Iron Ore (48.26%), Oil Seeds (25.02%), Fruits & Vegetables (19.91%), Ceramic Products & Glassware (17.36%), Rice (14.27%), Tea (8.81%), Cashew (2.81%), Coffee (1.71%) and Drugs & Pharmaceuticals (0.78%).
Exports of Electronic goods increased by 73.96 percent during May 2023 at USD 2.42 Billion as compared to USD 1.39 Billion in May 2022. During April-May 2023 electronic goods exports were recorded at USD 4.54 Billion as compared to USD 3.06 Billion during April-May 2022, registering a growth of 48.06 percent.
Enabling policies facilitating greater investment in electronics, mobile manufacturing, pharmaceuticals, etc. has resulted in visible growth in these sectors.
Effect of duty withdrawal on Iron Ore is visible on India’s exports of the item which have exhibited positive growth of 48.26 percent during May 2023 over the same month in 2022.
Textiles, Plastic & Linoleum exports continued to decline in May 2023 because of subdued demand due to recessionary effects in major economies.
The WTO trade growth projection has been revised to 1.7% from earlier projection of 1%, it is anticipated that demand revival is expected from July-August 2023 onwards.
Under merchandise imports, 16 out of 30 key sectors exhibited negative growth in May 2023. These include Silver (-93.92%), Sulphur & Unroasted Iron Pyrites (-81.88%), Cotton Raw & Waste (-39.81%), Gold (-38.71%), Vegetable Oil (-33.02%), Pearls, Precious & Semi-Precious Stones (-31.62%), Organic & Inorganic Chemicals (-20.26%), Coal, Coke & Briquettes, Etc. (-16.88%), Transport Equipment (-12.85%), Textile Yarn Fabric, Made-Up Articles (-11.93%), Artificial Resins, Plastic Materials, Etc. (-9.17%), Pulp And Waste Paper (-8.4%), Project Goods (-6.04%), Petroleum, Crude & Products (-5.97%), Wood & Wood Products (-3.4%) and Metaliferrous Ores & Other Minerals (-0.58%).
For April-May 2023, under merchandise exports, 13 of the 30 key sectors exhibited positive growth during April-May 2023 as compared to April-May 2022. These include Oil Meals (74.33%), Electronic Goods (48.06%), Spices (31.81%), Oil Seeds (20.94%), Rice (19%), Ceramic Products & Glassware (17.29%), Fruits & Vegetables (14.13%), Other Cereals (10.43%), Iron Ore (5.24%), Drugs & Pharmaceuticals (5.11%), Tea (3.03%), Coffee (2.98%) and Tobacco (2.01%).
Agricultural exports have been robust, registering promising growth.
Under merchandise imports, 21 of the 30 key sectors exhibited negative growth in April-May 2023 as compared to April-May 2022. These include Silver (-74.8%), Sulphur & Unroasted Iron Pyrites (-69.62%), Project Goods (-50.54%), Gold (-39.32%), Vegetable Oil (-35.4%), Cotton Raw & Waste (-30.64%), Organic & Inorganic Chemicals (-26.05%), Pearls, Precious & Semi-Precious Stones (-25.36%), Coal, Coke & Briquettes, Etc. (-22.55%), Textile Yarn Fabric, Made-Up Articles (-14.37%), Fertilisers, Crude & Manufactured (-14.12%), Transport Equipment (-13.76%), Metaliferrous Ores & Other Minerals (-13.23%), Petroleum, Crude & Products (-10.08%), Medicinal & Pharmaceutical Products (-8.78%), Leather & Leather Products (-7.77%), Artificial Resins, Plastic Materials, Etc. (-7.67%), Fruits & Vegetables (-6.55%), Wood & Wood Products (-4.62%), Dyeing/Tanning/Colouring Materials (-2.8%), Chemical Material & Products (-1.81%).
The decline in import value of petroleum, vegetable oil, coal, coke & briquette, etc has been largely on account of decline in commodity prices. Decline in gold import has been largely on account of import duty.
Silver imports slumped by 93.92 percent from USD 0.45 Billion in May 2022 to USD 0.03 Billion in May 2023.
Services exports remain strong and projected to grow at 4.01 percent during April-May 2023 over April-May 2022.
India’s trade deficit has shown considerable decline in April-May 2023. Overall trade deficit for April-May 2023* is estimated at USD 13.28 Billion as compared to the deficit of USD 20.56 Billion during April-May 2022, registering a decline of (-) 35.41 percent. The merchandise trade deficit during April-May 2023 was USD 37.26 Billion compared to USD 40.48 Billion during April-May 2022, registering a decline of (-) 7.95 percent.

