

Just a moment...

Top
Help
×

By creating an account you can:

Logo TaxTMI
>
Call Us / Help / Feedback

Contact Us At :

E-mail: [email protected]

Call / WhatsApp at: +91 99117 96707

For more information, Check Contact Us

FAQs :

To know Frequently Asked Questions, Check FAQs

Most Asked Video Tutorials :

For more tutorials, Check Video Tutorials

Submit Feedback/Suggestion :

Email :
Please provide your email address so we can follow up on your feedback.
Category :
Description :
Min 15 characters0/2000
Make Most of Text Search
  1. Checkout this video tutorial: How to search effectively on TaxTMI.
  2. Put words in double quotes for exact word search, eg: "income tax"
  3. Avoid noise words such as : 'and, of, the, a'
  4. Sort by Relevance to get the most relevant document.
  5. Press Enter to add multiple terms/multiple phrases, and then click on Search to Search.
  6. Text Search
  7. The system will try to fetch results that contains ALL your words.
  8. Once you add keywords, you'll see a new 'Search In' filter that makes your results even more precise.
  9. Text Search
Add to...
You have not created any category. Kindly create one to bookmark this item!
Create New Category
Hide
Title :
Description :
❮❮ Hide
Default View
Expand ❯❯
Close ✕
🔎 News - Adv. Search
TEXT SEARCH:

Press 'Enter' to add multiple search terms. Rules for Better Search

Search In:
Main Text + AI Text
  • Main Text
  • Main Text + AI Text
  • AI Text
Category: ?
Categorized by AI
---- All Categories ----
  • ---- All Categories ----
  • Income Tax
  • GST
  • Customs, DGFT & SEZ
  • FEMA & RBI
  • Corp. Laws, SEBI & IBC
  • PMLA, Black Money & ED
  • Budget
  • News and Press Release
  • PTI News
Month:
---- All Months ----
  • ---- All Months ----
  • January
  • February
  • March
  • April
  • May
  • June
  • July
  • August
  • September
  • October
  • November
  • December
Year:
---- All Years ----
  • ---- All Years ----
  • 2026
  • 2025
  • 2024
  • 2023
  • 2022
  • 2021
  • 2020
  • 2019
  • 2018
  • 2017
  • 2016
  • 2015
  • 2014
  • 2013
  • 2012
  • 2011
Sort By: ?
In Sort By 'Default', exact matches for text search are shown at the top, followed by the remaining results in their regular order.
RelevanceDefaultDate
    No Records Found
    ❯❯
    MaximizeMaximizeMaximize
    0 / 200
    Expand Note
    Add to Folder

    No Folders have been created

      +

      Are you sure you want to delete "My most important" ?

      NOTE:

      News
      Showing Results for :
      Reset Filters
      Results Found:
      AI TextQuick Glance by AIHeadnote
      Show All SummariesHide All Summaries
      No Records Found

      News

      Back

      All News

      Showing Results for :
      Reset Filters
      Showing
      Records
      ExpandCollapse
        No Records Found

        News

        Back

        All News

        whatsappJoin Channel
        Showing Results for : Reset Filters
        Case ID :
        Customs, DGFT & SEZ

        India’s Services exports for the first time achieve the targeted $ 250 Billion during April-March 2021-22, exhibiting a positive growth of 21.31 per cent over the fiscal 2020-21

        April 14, 2022

        📋
        Contents
        Note

        Note

        -

        Bookmark

        print

        Print

        Login to TaxTMI
        Verification Pending

        The Email Id has not been verified. Click on the link we have sent on

        Didn't receive the mail? Resend Mail

        Don't have an account? Register Here

        India’s Services exports for the first time achieve the targeted $ 250 Billion during April-March 2021-22, exhibiting a positive growth of 21.31 per cent over the fiscal 2020-21

        India’s overall exports (Merchandise and Services) touch an all-time high of USD 669.65 Billion in April-March 2021-22, jumping by 34.50 per cent over the same period last year

        “Services sector achieved the all-time high despite Services like Tourism, Aviation and Hospitality industry being severely affected due to the Covid-19 pandemic”: Shri Piyush Goyal

        India’s exports grow by 15.51 per cent in March 2022 to USD 64.75 Billion over same period last year

        INDIA’S FOREIGN TRADE: March 2022

        India’s Services exports for the first time achieved the targeted $ 250 Billion during April-March 2021-22*, exhibiting a positive growth of 21.31 per cent over the fiscal 2020-21. For the month of March 2022, the estimated value of Services export is USD 22.52 Billion, exhibiting a positive growth of 8.31 per cent vis-a-vis March 2021.

        India’s overall exports (Merchandise and Services) touched an all-time high of USD 669.65 Billion in April-March 2021-22, jumping by 34.50 per cent over the same period last year. For the last month, March 2022, India’s exports grew by 15.51 per cent in March 2022 to USD 64.75 Billion over the same period last year.

        Addressing a press conference here, the Minister of Commerce and Industry, Consumer Affairs, Food and Public Distribution and Textiles, Shri Piyush Goyal said India has achieved this exports high despite the slowdown in economy worldwide due to the Covid-19 pandemic and the recent geopolitical developments in Europe.

         “Services sector has achieved the all-time high despite Services like Tourism, Aviation and Hospitality industry being severely affected due to the Covid-19 pandemic,” he said.

         Shri Goyal said India has been able to exceed the overall exports target of $ 650 Billion due to the visionary leadership of the Prime Minister Shri Narendra Modi that we turn India into an export focussed economy. “The PM himself conducted meetings with India’s 180 missions abroad. Hectic parleys were held with the Export Promotion Councils and then the bar was set high, and yet doable,” he said.

         Shri Goyal said if we have to make India a developed nation, we will have to increase our international engagement. Government has struck vital trade deals with the UAE and Australia towards this end, he said, adding more FTAs and Comprehensive Trade Agreements are in the works with the EU, UK, Canada and Israel.

         “Starting from ‘whole of the Government’ approach, today ‘Whole of the Nation’ has joined hands to make India emerge as a trusted partner at the international level, dedicating itself to turn into an economy that provides quality goods and services to the world,” he said.

         Following are details of India’s Trade Data statistics:

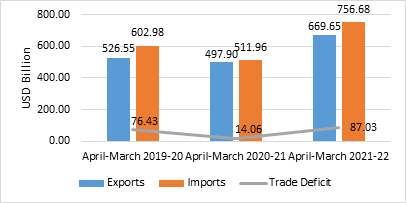
         India’s overall exports (Merchandise and Services combined) in April-March 2021-22* are estimated to be USD 669.65 Billion, exhibiting a positive growth of 34.50 per cent over the same period last year and a positive growth of 27.18 per cent over April-March 2019-20. Overall imports in April-March 2021-22* are estimated to be USD 756.68 Billion, exhibiting a positive growth of 47.80 per cent over the same period last year and a positive growth of 25.49 per cent over April-March 2019-20.

        Table 2: Trade during April-March 2021-22*


        April-March 2021-22

        (USD Billion)

        April-March 2020-21

        (USD Billion)

        April-March 2019-20

        (USD Billion)

        Growth vis-à-vis April-March 2020-21 (%)

        Growth vis-à-vis April-March 2019-20 (%)

        Merchandise

        Exports

        419.65

        291.81

        313.36

        43.81

        33.92

        Imports

        611.89

        394.44

        474.71

        55.13

        28.90

        Trade Balance

        -192.24

        -102.63

        -161.35

        -87.32

        -19.15

        Services*

        Exports

        250.00

        206.09

        213.19

        21.31

        17.27

        Imports

        144.79

        117.52

        128.27

        23.20

        12.88

        Net of Services

        105.21

        88.57

        84.92

        18.80

        23.89

        Overall Trade (Merchandise+

        Services)*

        Exports

        669.65

        497.90

        526.55

        34.50

        27.18

        Imports

        756.68

        511.96

        602.98

        47.80

        25.49

        Trade Balance

        -87.03

        -14.06

        -76.43

        -518.87

        -13.87

        * Note: The latest data for services sector released by RBI is for February 2022. The data for March 2022 is an estimation, which will be revised based on RBI’s subsequent release. (ii) Data for 2019, 2020 and April to December 2021 are revised on pro-rata basis using quarterly balance of payments data.

        Fig 2: Overall Trade during April-March 2022*
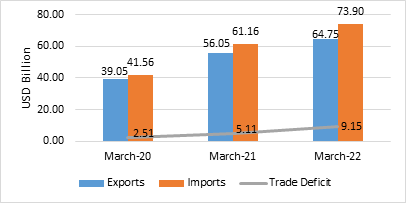
        • India’s overall exports (Merchandise and Services combined) in March 2022* are estimated to be USD 64.75 Billion, exhibiting a positive growth of 15.51 per cent over the same period last year and a positive growth of 65.80 per cent over March 2020. Overall imports in March 2022* are estimated to be USD 73.90 Billion, exhibiting a positive growth of 20.83 per cent over the same period last year and a positive growth of 77.82 per cent over March 2020.

        Table 1: Trade during March 2022*


        March 2022

        (USD Billion)

        March 2021

        (USD Billion)

        March 2020

        (USD Billion)

        Growth vis-à-vis March 2021 (%)

        Growth vis-à-vis March 2020 (%)

        Merchandise

        Exports

        42.22

        35.26

        21.49

        19.76

        96.48

        Imports

        60.74

        48.90

        31.47

        24.21

        93.00

        Trade Balance

        -18.51

        -13.64

        -9.98

        -35.72

        -85.51

        Services*

        Exports

        22.52

        20.80

        17.56

        8.31

        28.25

        Imports

        13.16

        12.26

        10.09

        7.33

        30.46

        Net of Services

        9.36

        8.53

        7.47

        9.71

        25.28

        Overall Trade (Merchandise+

        Services)*

        Exports

        64.75

        56.05

        39.05

        15.51

        65.80

        Imports

        73.90

        61.16

        41.56

        20.83

        77.82

        Trade Balance

        -9.15

        -5.11

        -2.51

        -79.18

        -265.14

        * Note: The latest data for services sector released by RBI is for February 2022. The data for March 2022 is an estimation, which will be revised based on RBI’s subsequent release. (ii) Data for 2019, 2020 and April to December 2021 are revised on pro-rata basis using quarterly balance of payments data.

        Fig 1: Overall Trade during March 2022*
        MERCHANDISE TRADE

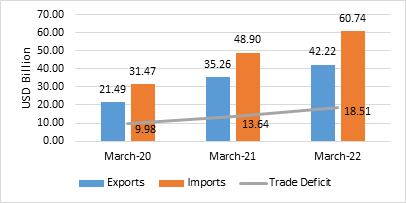
        • Merchandise exports in March 2022 were USD 42.22 Billion, as compared to USD 35.26 Billion in March 2021, exhibiting a positive growth of 19.76 per cent. As compared to March 2020, exports in March 2022 exhibited a positive growth of 96.48 per cent.
        • Merchandise imports in March 2022 were USD 60.74 Billion, which is an increase of 24.21 per cent over imports of USD 48.90 Billion in March 2021. Imports in March 2022 have registered a positive growth of 93.00 per cent in comparison to March 2020.
        • The merchandise trade balance for March 2022 was estimated at USD (-) 18.51 Billion as against USD (-) 13.64 Billion in March 2021, which is a decline of (-) 35.72 per cent. As compared to March 2020 (USD (-) 9.98 Billion), trade balance in March 2022 exhibited a negative growth of (-) 85.51 per cent.


        Fig 3: Merchandise Trade during March 2022
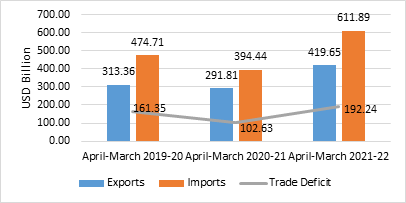
        • Merchandise exports for the period April-March 2021-22 was USD 419.65 Billion as against USD 291.81 Billion during the period April-March 2020-21, registering a positive growth of 43.81 per cent. As compared to April-March 2019-20, exports in April-March 2021-22 exhibited a positive growth of 33.92 per cent.
        • Merchandise imports for the period April-March 2021-22 was USD 611.89 Billion as against USD 394.44 Billion during the period April-March 2020-21, registering a positive growth of 55.13 per cent. Imports in April-March 2021-22 have registered a positive growth of 28.90 per cent in comparison to April-March 2019-20.
        • The merchandise trade balance for April-March 2021-22 was estimated at USD (-) 192.24 Billion as against USD (-) 102.63 Billion in April-March 2020-21, which is a decline of (-) 87.32 per cent. As compared to April-March 2019-20 (USD (-) 161.35 Billion), trade balance in April-March 2021-22 exhibited a negative growth of (-) 19.15 per cent.

        Fig 4: Merchandise Trade during April-March 2021-22
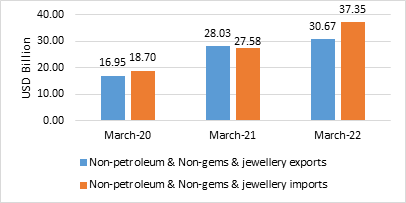
        • Non-petroleum and non-gems & jewellery exports in March 2022 were USD 30.67 Billion, registering a positive growth of 9.40 per cent over non-petroleum and non-gems & jewellery exports of USD 28.03 Billion in March 2021 and a positive growth of 80.90 per cent over non-petroleum and non-gems & jewellery exports of USD 16.95 Billion in March 2020.
        • Non-petroleum, non-gems & jewellery (gold, silver & precious metals) imports were USD 37.35 Billion in March 2022 with a positive growth of 35.44 per cent over Non-petroleum, non-gems & jewellery imports of USD 27.58 Billion in March 2021 and a positive growth of 99.77 per cent over Non-petroleum, non-gems & jewellery imports of USD 18.70 Billion in March 2020.

         Table 3: Trade excluding Petroleum and Gems & Jewellery during March 2022


        March 2022

        (USD Billion)

        March 2021

        (USD Billion)

        March 2020

        (USD Billion)

        Growth vis-à-vis March 2021 (%)

        Growth vis-à-vis March 2020 (%)

        Non- petroleum exports

        34.45

        31.65

        18.97

        8.85

        81.57

        Non- petroleum imports

        41.95

        38.63

        21.42

        8.59

        95.79

        Non-petroleum & Non Gems & Jewellery exports

        30.67

        28.03

        16.95

        9.40

        80.90

        Non-petroleum & Non Gems & Jewellery imports*

        37.35

        27.58

        18.70

        35.44

        99.77

        Note: Gems & Jewellery Imports include Gold, Silver & Pearls, precious & Semi-precious stones

        Fig 5: Trade excluding Petroleum and Gems & Jewellery during March 2022
         

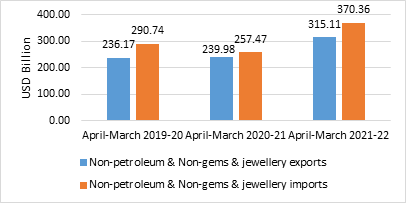
        • Non-petroleum and non-gems & jewellery exports during April-March 2021-22 was USD 315.11 Billion, an increase of 31.31 per cent over non-petroleum and non-gems & jewellery exports of USD 239.98 Billion in April-March 2020-21 and an increase of 33.42 per cent over non-petroleum and non-gems & jewellery exports of USD 236.17 Billion in April-March 2019-20.
        • Non-petroleum, non-gems & jewellery (gold, silver & precious metals) imports were USD 370.36 Billion in April-March 2021-22, recording a positive growth of 43.85 per cent, as compared to Non-petroleum, non-gems & jewellery imports of USD 257.47 Billion in April-March 2020-21 and a positive growth of 27.38 per cent over USD 290.74 Billion in April-March 2019-20.

        Table 4: Trade excluding Petroleum and Gems & Jewellery during April-March 2021-22


        April-March 2021-22

        (USD Billion)

        April-March 2020-21

        (USD Billion)

        April-March 2019-20

        (USD Billion)

        Growth vis-à-vis April-March 2020-21 (%)

        Growth vis-à-vis April-March 2019-20 (%)

        Non- petroleum exports

        354.21

        266.00

        272.07

        33.16

        30.19

        Non- petroleum imports

        450.82

        311.75

        344.16

        44.61

        30.99

        Non-petroleum & Non Gems & Jewellery exports

        315.11

        239.98

        236.17

        31.31

        33.42

        Non-petroleum & Non Gems & Jewellery imports*

        370.36

        257.47

        290.74

        43.85

        27.38

        Note: Gems & Jewellery Imports include Gold, Silver & Pearls, precious & Semi-precious stones

          Fig 6: Trade excluding Petroleum and Gems & Jewellery during April-March 2021-22
        SERVICES TRADE

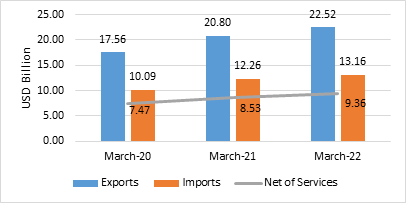
        • The estimated value of services export for March 2022* is USD 22.52 Billion, exhibiting a positive growth of 8.31 per cent vis-a-vis March 2021 (USD 20.80 Billion) and a positive growth of 28.25 per cent vis-à-vis March 2020 (USD 17.56 Billion).
        • The estimated value of services import for March 2022* is USD 13.16 Billion exhibiting a positive growth of 7.33 per cent vis-à-vis March 2021 (USD 12.26 Billion) and a positive growth of 30.46 per cent vis-à-vis March 2020 (USD 10.09 Billion).
        • The services trade balance in March 2022* is estimated at USD 9.36 Billion, which is an increase of 9.71 per cent over March 2021 (USD 8.53 Billion) and an increase of 25.28 per cent over March 2020 (USD 7.47 Billion).

        Fig 7: Services Trade during March 2022*
        • The estimated value of services export for April-March 2021-22* is USD 250.00 Billion, exhibiting a positive growth of 21.31 per cent vis-a-vis April-March 2020-21 (USD 206.09 Billion) and a positive growth of 17.27 per cent vis-à-vis April-March 2019-20 (USD 213.19 Billion).
        • The estimated value of services imports for April-March 2021-22* is USD 144.79 Billion exhibiting a positive growth of 23.20 per cent vis-à-vis April-March 2020-21 (USD 117.52 Billion) and a positive growth of 12.88 per cent vis-à-vis April-March 2019-20 (USD 128.27 Billion).
        • The services trade balance for April-March 2021-22* was estimated at USD 105.21 Billion as against USD 88.57 Billion in April-March 2020-21, which is an increase of 18.80 per cent. As compared to April-March 2019-20 (USD 84.92 Billion), net of services in April-March 2021-22* exhibited a positive growth of 23.89 per cent. 

        Fig 8: Services Trade during April-March 2021-22*
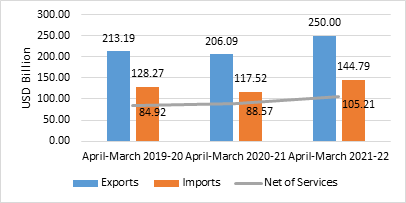
         Table 5: Export Growth in Commodity Groups in March 2022

        Sl. No.

        Commodities

        (Values in Million USD)

        % Change

        MAR'21

        MAR'22

        MAR'22


        Commodity groups exhibiting positive growth

        1

        Petroleum Products

        3609.36

        7775.16

        115.42

        2

        Leather & leather products

        317.79

        413.11

        29.99

        3

        Electronic Goods

        1400.67

        1818.42

        29.82

        4

        Cereal preparations & miscellaneous processed items

        191.60

        242.02

        26.32

        5

        Other cereals

        78.80

        97.04

        23.15

        6

        RMG of all Textiles

        1425.95

        1740.35

        22.05

        7

        Organic & Inorganic Chemicals

        2288.87

        2793.18

        22.03

        8

        Cotton Yarn/Fabs./made-ups, Handloom Products etc.

        1105.05

        1342.97

        21.53

        9

        Plastic & Linoleum

        719.54

        850.71

        18.23

        10

        Coffee

        97.41

        114.70

        17.75

        11

        Engineering Goods

        9298.36

        10877.53

        16.98

        12

        Man-made Yarn/Fabs./made-ups etc.

        459.94

        527.69

        14.73

        13

        Jute Mfg. including Floor Covering

        44.48

        49.29

        10.82

        14

        Tea

        53.38

        58.27

        9.16

        15

        Marine Products

        554.25

        598.23

        7.93

        16

        Meat, dairy & poultry products

        345.05

        368.68

        6.85

        17

        Gems & Jewellery

        3613.01

        3779.52

        4.61

        18

        Ceramic products & glassware

        323.45

        337.79

        4.43

        19

        Drugs & Pharmaceuticals

        2295.05

        2391.41

        4.20

        20

        Tobacco

        85.62

        86.42

        0.93

        Sl. No.

        Commodities

        (Values in Million USD)

        % Change

        MAR'21

        MAR'22

        MAR'22


        Commodity Groups exhibiting negative growth

        21

        Iron Ore

        720.88

        339.83

        -52.86

        22

        Oil Meals

        193.91

        101.00

        -47.91

        23

        Mica, Coal & Other Ores, Minerals including processed minerals

        952.95

        569.88

        -40.20

        24

        Oil seeds

        107.67

        87.56

        -18.68

        25

        Spices

        447.78

        388.16

        -13.31

        26

        Rice

        1116.54

        1023.33

        -8.35

        27

        Handicrafts excl. hand made carpet

        176.71

        174.26

        -1.39

        28

        Carpet

        157.17

        155.09

        -1.32

        29

        Fruits & Vegetables

        377.10

        372.72

        -1.16

        30

        Cashew

        40.44

        40.09

        -0.87

         Table 6: Import Growth in Commodity Groups in March 2022

        Sl. No.

        Commodities

        (Values in Million USD)

        % Change

        MAR'21

        MAR'22

        MAR'22


        Commodity Groups exhibiting positive growth

        1

        Silver

        9.85

        124.98

        1168.83

        2

        Fertilisers, Crude & manufactured

        204.16

        1656.78

        711.51

        3

        Coal, Coke & Briquettes, etc.

        1735.74

        4594.32

        164.69

        4

        Pulses

        77.28

        142.84

        84.83

        5

        Petroleum, Crude & products

        10271.38

        18793.68

        82.97

        6

        Medicinal & Pharmaceutical products

        630.08

        1148.93

        82.35

        7

         Vegetable Oil

        1076.81

        1734.60

        61.09

        8

        Pulp and Waste paper

        91.38

        146.03

        59.81

        9

        Newsprint

        17.54

        27.74

        58.15

        10

        Cotton Raw & Waste

        40.42

        61.97

        53.32

        11

        Electronic goods

        5864.15

        8530.46

        45.47

        12

        Pearls, precious & Semi-precious stones

        2547.27

        3428.31

        34.59

        13

        Organic & Inorganic Chemicals

        2102.57

        2792.15

        32.80

        14

        Metaliferrous ores & other minerals

        455.83

        586.51

        28.67

        15

        Leather & leather products

        69.35

        81.49

        17.51

        16

        Fruits & vegetables

        185.43

        217.48

        17.28

        17

        Iron & Steel

        1328.44

        1493.30

        12.41

        18

        Non-ferrous metals

        1400.11

        1572.58

        12.32

        19

        Artificial resins, plastic materials, etc.

        1719.92

        1928.57

        12.13

        20

        Sulphur & Unroasted Iron Pyrites

        27.82

        29.59

        6.36

        21

        Wood &  Wood products

        526.99

        546.00

        3.61

        22

        Machinery, electrical & non-electrical

        3513.68

        3546.06

        0.92

        Sl. No.

        Commodities

        (Values in Million USD)

        % Change

        MAR'21

        MAR'22

        MAR'22


        Commodity Groups exhibiting negative growth

        23

        Gold

        8493.69

        1041.17

        -87.74

        24

        Project goods

        66.10

        45.85

        -30.64

        25

        Dyeing/tanning/colouring materials.

        385.55

        342.36

        -11.20

        26

        Machine tools

        355.36

        325.05

        -8.53

        27

        Transport equipment

        2210.75

        2032.72

        -8.05

        28

        Professional instrument, Optical goods, etc.

        560.18

        532.08

        -5.02

        29

        Textile yarn Fabric, made-up articles

        167.98

        163.41

        -2.72

        30

        Chemical material & products

        914.21

        909.74

        -0.49

         Table 7: MERCHANDISE TRADE 

        EXPORTS & IMPORTS: (Rs. Crore)

        (PROVISIONAL)


        MARCH

        APRIL-MARCH

        EXPORTS(including re-exports)


        2019-20

        1,59,784.62

        22,19,854.18

        2020-21

        2,56,642.68

        21,59,043.22

        2021-22

        3,21,934.84

        31,29,096.20

        %Growth 2021-22/ 2020-21

        25.44

        44.93

        %Growth 2021-22/ 2019-20

        101.48

        40.96

        IMPORTS


        2019-20

        2,33,988.47

        33,60,954.46

        2020-21

        3,55,948.52

        29,15,957.70

        2021-22

        4,63,100.32

        45,63,803.96

        %Growth 2021-22/ 2020-21

        30.10

        56.51

        %Growth 2021-22/ 2019-20

        97.92

        35.79

        TRADE BALANCE


        2019-20

        -74,203.85

        -11,41,100.28

        2020-21

        -99,305.84

        -7,56,914.48

        2021-22

        -1,41,165.48

        -14,34,707.75

         Table 8: SERVICES TRADE

        EXPORTS & IMPORTS (SERVICES) : (US $ Billion)


        (PROVISIONAL)

        February 2022

        April-

        February 2021-22

        EXPORTS (Receipts)

        21.25

        227.48

        IMPORTS (Payments)

        12.95

        131.62

        TRADE BALANCE

        8.30

        95.85


        EXPORTS & IMPORTS (SERVICES): (Rs. Crore)


        (PROVISIONAL)

        February 2022

        April-

        February 2021-22

        EXPORTS (Receipts)

        1,59,381.59

        16,91,958.35

        IMPORTS (Payments)

        97,159.02

        9,79,163.99

        TRADE BALANCE

        62,222.57

        7,12,794.35

        Source: RBI Press Release dated 1st April 2022


        *Link for quick Estimates

        Services exports milestone achieved, boosting overall export levels while March services estimates remain provisional pending RBI revision. Services exports achieved the targeted milestone for April-March 2021-22, recording significant year on year growth and contributing to an all time high in overall exports. March services estimates show positive growth but are provisional and will be revised based on subsequent RBI releases. Merchandise and non petroleum non gems & jewellery trade also registered strong growth, while the merchandise trade deficit widened year on year.
                          Cases where this provision is explicitly mentioned in the judgment/order text; may not be exhaustive. To view the complete list of cases mentioning this section, Click here.
                            Provisions expressly mentioned in the judgment/order text.

                                Services exports milestone achieved, boosting overall export levels while March services estimates remain provisional pending RBI revision.

                                Services exports achieved the targeted milestone for April-March 2021-22, recording significant year on year growth and contributing to an all time high in overall exports. March services estimates show positive growth but are provisional and will be revised based on subsequent RBI releases. Merchandise and non petroleum non gems & jewellery trade also registered strong growth, while the merchandise trade deficit widened year on year.


                                Note: It is a system-generated summary and is for quick reference only.

                                Topics

                                ActsIncome Tax
                                No Records Found