 TaxTMI
 Login
 TaxTMI
Login
Loading...
Press 'Enter' to add multiple search terms. Rules for Better Search

Press 'Enter' after typing page number.
Press 'Enter' after typing page number.


No Folders have been created
Are you sure you want to delete "My most important" ?
NOTE:
Press 'Enter' after typing page number.
Press 'Enter' after typing page number.

All News
Press 'Enter' after typing page number.
All News

Note

Bookmark

Share


India’s merchandise export in February 2022 increases by 22.36% to USD 33.81 billion over USD 27.63 billion in February 2021
India’s merchandise export in April 2021-February 2022 rises by 45.80% to USD 374.05 billion over USD 256.55 billion in April 2020-February 2021
INDIA’S MERCHANDISE TRADE: Preliminary Data for February 2022
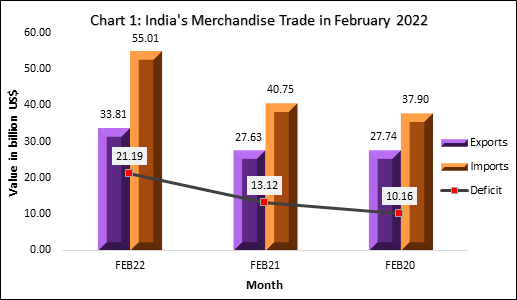
India’s merchandise export in February 2022 was USD 33.81 billion, an increase of 22.36% over USD 27.63 billion in February 2021 and an increase of 21.88% over USD 27.74 billion in February 2020.
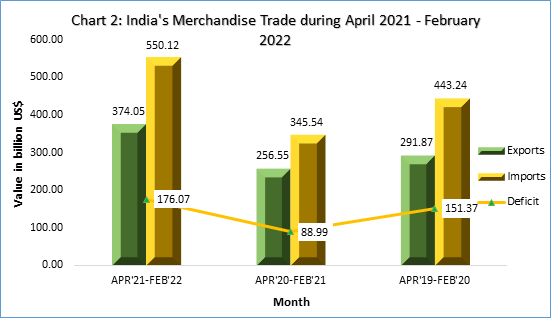
India’s merchandise export in April 2021-February 2022 was USD 374.05 billion, an increase of 45.80% over USD 256.55 billion in April 2020-February 2021 and an increase of 28.16% over USD 291.87 billion in April 2019-February 2020.
India’s merchandise import in February 2022 was USD 55.01 billion, an increase of 34.99% over USD 40.75 billion in February 2021 and an increase of 45.12% over USD 37.90 billion in February 2020.
India’s merchandise import in April 2021-February 2022 was USD 550.12 billion, an increase of 59.21% over USD 345.54 billion in April 2020-February 2021 and an increase of 24.11% over USD 443.24 billion in April 2019-February 2020.
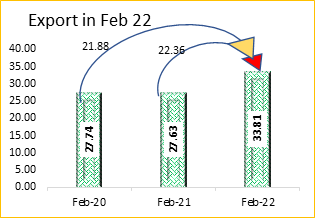
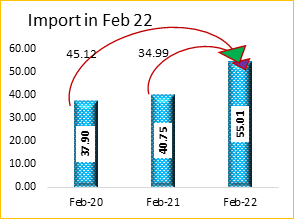
The trade deficit in February 2022 was USD 21.19 billion, while it was 176.07 billion USD during April 2021-February 2022.
| Statement 1: India’s Trade in Merchandise goods in February 2022 | |||||
|
| Value in Billion USD | % Growth | |||
| Feb-22 | Feb-21 | Feb-20 | Feb-22 over Feb-21 | Feb-22 over Feb-20 | |
| Exports | 33.81 | 27.63 | 27.74 | 22.36 | 21.88 |
| Imports | 55.01 | 40.75 | 37.90 | 34.99 | 45.12 |
| Deficit | 21.19 | 13.12 | 10.16 | 61.59 | 108.56 |
| Statement 2: India’s Trade in Merchandise goods in Apr 2021-Feb 2022 | |||||
|
| Value in Billion USD | % Growth | |||
|
| Apr21-Feb22 | Apr20-Feb21 | Apr19-Feb20 | Apr21-Feb 22 over Apr20-Feb 21 | Apr21-Feb 22 over Apr19-Feb 20 |
| Exports | 374.05 | 256.55 | 291.87 | 45.80 | 28.16 |
| Imports | 550.12 | 345.54 | 443.24 | 59.21 | 24.11 |
| Deficit | 176.07 | 88.99 | 151.37 | 97.86 | 16.32 |
Value of non-petroleum exports in February 2022 was 29.70 USD billion, registering a positive growth of 18.04% over non-petroleum exports of USD 25.16 billion in February 2021 and a positive growth of 22.23% over non-petroleum exports of USD 24.30 billion in February 2020.
Value of non-petroleum imports was USD 39.96 billion in February 2022 with a positive growth of 26.0% over non-petroleum imports of USD 31.72 billion in February 2021 and a positive growth of 47.33% over non-petroleum imports of USD 27.12 billion in February 2020.
| Statement 3: Merchandise Non-POL Trade in February 2022 | |||||
|
| Value in Billion USD | % Growth | |||
|
| Feb-22 | Feb-21 | Feb-20 | Feb-22 over Feb-21 | Feb-22 over Feb-20 |
| Exports | 29.70 | 25.16 | 24.30 | 18.04 | 22.23 |
| Imports | 39.96 | 31.72 | 27.12 | 26.00 | 47.33 |
The cumulative value of non-petroleum exports in April 2021-February 2022 was USD 319.09 billion, an increase of 36.16% over USD 234.36 billion in April 2020-February 2021 and an increase of 26.07% over USD 253.10 billion in April 2019-February 2020.
The cumulative value of non-petroleum imports in April 2021-Feb 2022 was USD 408.63 billion, showing an increase of 49.61% compared to non-oil imports of USD 273.12 billion in April 2020-Feb 2021 and an increase of 26.61% compared to non-oil imports of USD 322.74 billion in April 2019-Feb 2020.
| Statement 4: Merchandise Non-POL Trade Apr 2021-Feb 2022 | |||||
|
| Value in Billion USD | % Growth | |||
|
| Apr21-Feb22 | Apr20-Feb21 | Apr19-Feb20 | Apr21-Feb 22 over Apr20-Feb 21 | Apr21-Feb 22 over Apr19-Feb 20 |
| Exports | 319.09 | 234.36 | 253.10 | 36.16 | 26.07 |
| Imports | 408.63 | 273.12 | 322.74 | 49.61 | 26.61 |
Value of non-petroleum and non-gems and jewellery exports in February 2022 was USD 26.60 billion, registering a positive growth of 18.31% over non-petroleum and non-gems and jewellery exports of USD 22.48 billion in February 2021 and a positive growth of 24.98% over non-petroleum and non-gems and jewellery exports of USD 21.28 billion in February 2020.
Value of non-oil, non-GJ (gold, silver & Precious metals) imports was USD 31.61 billion in February 2022 with a positive growth of 31.66% over non-oil and non-GJ imports of USD 24.01 billion in Feb 2021 and a positive growth of 42.31% over non-oil and non-GJ imports of USD 22.21 billion in Feb 2020.
| Statement 5: Merchandise Non-POL Non-GJ Trade in February 2022 | |||||
|
| Value in Billion USD | % Growth | |||
|
| Feb-22 | Feb-21 | Feb-20 | Feb-22 over Feb-21 | Feb-22 over Feb-20 |
| Exports | 26.60 | 22.48 | 21.28 | 18.31 | 24.98 |
| Imports | 31.61 | 24.01 | 22.21 | 31.66 | 42.31 |
The cumulative value of non-petroleum and non-gems and jewellery exports in April 2021-February 2022 was USD 283.83 billion, an increase of 33.92% over cumulative value of non-petroleum and non-gems and jewellery exports of USD 211.95 billion in April 2020-February 2021 and an increase of 29.47% over cumulative value of non-petroleum and non-gems and jewellery exports of USD 219.22 billion in April 2019-February 2020.
Non-oil, non-GJ (Gold, Silver & Precious Metals) imports was USD 332.85 billion in April 2021-February 2022, recording a positive growth of 44.78%, as compared to non-oil and non-GJ imports of USD 229.89 billion in April 2020-February 2021 and a positive growth of 22.35% over USD 272.05 billion in April 2019-February 2020.
| Statement 6: Merchandise Non-POL Non-GJ Trade Apr 2021-Feb 2022 | |||||
|
| Value in Billion USD | % Growth | |||
|
| Apr21-Feb22 | Apr20-Feb21 | Apr19-Feb20 | Apr21-Feb 22 over Apr20-Feb 21 | Apr21-Feb 22 over Apr19-Feb 20 |
| Exports | 283.83 | 211.95 | 219.22 | 33.92 | 29.47 |
| Imports | 332.85 | 229.89 | 272.05 | 44.78 | 22.35 |
Top 10 major commodity groups covering 80% of total exports in February 2022 are as follows:
| Statement 7: Exports of Top 10 Major Commodity Groups in February 2022 | ||||
| Value of Export (Million US$) | Share (%) | Growth (%) | ||
| Major Commodity Group | Feb-22 | Feb-21 | Feb-22 | Feb-22 over Feb-21 |
| Engineering goods | 9272.37 | 7059.91 | 27.42 | 31.34 |
| Petroleum products | 4109.38 | 2471.16 | 12.15 | 66.29 |
| Gems and Jewellery | 3105.59 | 2682.08 | 9.18 | 15.79 |
| Organic and Inorganic chemicals | 2407.81 | 1930.21 | 7.12 | 24.74 |
| Drugs and Pharmaceuticals | 1938.79 | 2001.44 | 5.73 | -3.13 |
| RMG of all Textiles | 1598.64 | 1348.55 | 4.73 | 18.54 |
| Electronic goods | 1477.76 | 1104.69 | 4.37 | 33.77 |
| Cotton Yarn/Fabs./Madeups, Handloom products etc. | 1258.88 | 947.64 | 3.72 | 32.84 |
| Rice | 920.67 | 918.94 | 2.72 | 0.19 |
| Plastic and Linoleum | 793.34 | 631.19 | 2.35 | 25.69 |
| Total of 10 Major Commodity Groups | 26883.24 | 21095.80 | 79.51 | 27.43 |
| Rest | 6928.61 | 6537.45 | 20.49 | 5.98 |
| Total Exports | 33811.86 | 27633.25 | 100.00 | 22.36 |
Top 10 major commodity groups covering 78% of total imports in February 2022 are as follows:
| Statement 8: Imports of Top 10 Major Commodity Groups in February 2022 | ||||
| Import (Million US$) | Share (%) | Growth (%) | ||
| Major Commodity Group | Feb-22 | Feb-21 | Feb-22 | Feb-22 over Feb-21 |
| Petroleum, Crude & products | 15042.44 | 9031.45 | 27.35 | 66.56 |
| Electronic goods | 6244.93 | 4843.82 | 11.35 | 28.93 |
| Gold | 4684.79 | 5290.40 | 8.52 | -11.45 |
| Machinery, electrical & non-electrical | 3612.66 | 3184.00 | 6.57 | 13.46 |
| Pearls, precious & Semi-precious stones | 3186.03 | 2408.50 | 5.79 | 32.28 |
| Coal, Coke & Briquettes, etc. | 2860.20 | 1318.11 | 5.20 | 116.99 |
| Organic & Inorganic Chemicals | 2434.07 | 2039.23 | 4.43 | 19.36 |
| Artificial resins, plastic materials, etc. | 1704.53 | 1458.36 | 3.10 | 16.88 |
| Fertilisers, Crude & manufactured | 1670.20 | 224.57 | 3.04 | 643.73 |
| Iron & Steel | 1603.74 | 1239.36 | 2.92 | 29.40 |
| Total of 10 Major Commodity Groups | 43043.59 | 31037.80 | 78.25 | 38.68 |
| Rest | 11961.83 | 9710.85 | 21.75 | 23.18 |
| Total Imports | 55005.42 | 40748.65 | 100.00 | 34.99 |
Top 10 major commodity groups covering 80% of total exports in April 2021 –Feb 2022 are as follows:
| Statement 9: Exports of Top 10 Major Commodity Groups in April 2021-February 2022 | ||||
| Value of Export (Million US$) | Share (%) | Growth (%) | ||
| Major Commodity Group | Apr21-Feb22 | Apr20-Feb21 | Apr21-Feb22 | Apr21-Feb22 over Apr20-Feb21 |
| Engineering goods | 100927.31 | 67421.24 | 26.98 | 49.70 |
| Petroleum products | 54958.67 | 22195.00 | 14.69 | 147.62 |
| Gems and Jewellery | 35258.63 | 22409.82 | 9.43 | 57.34 |
| Organic and Inorganic chemicals | 26470.62 | 19799.60 | 7.08 | 33.69 |
| Drugs and Pharmaceuticals | 22185.08 | 22148.98 | 5.93 | 0.16 |
| RMG of all Textiles | 14273.26 | 10846.26 | 3.82 | 31.60 |
| Cotton Yarn/Fabs./Madeups, Handloom products etc. | 13949.35 | 8722.84 | 3.73 | 59.92 |
| Electronic goods | 13838.07 | 9692.61 | 3.70 | 42.77 |
| Plastic and Linoleum | 8961.25 | 6743.31 | 2.40 | 32.89 |
| Rice | 8617.48 | 7712.67 | 2.30 | 11.73 |
| Total of 10 Major Commodity Groups | 299439.72 | 197692.35 | 80.05 | 51.47 |
| Rest | 74610.74 | 58859.53 | 19.95 | 26.76 |
| Total Exports | 374050.47 | 256551.88 | 100.00 | 45.80 |
Top 10 major commodity groups covering 77% of total imports in April 2021 -Feb 2022 are as follows:
| Statement 10: Imports of Top 10 Major Commodity Groups in April 2021-February 2022 | ||||
| Import (Million US$) | Share (%) | Growth (%) | ||
| Major Commodity Group | Apr21-Feb22 | Apr20-Feb21 | Apr21-Feb22 | Apr21-Feb22 over Apr20-Feb21 |
| Petroleum, Crude & products | 141486.97 | 72412.48 | 27.35 | 95.39 |
| Electronic goods | 64745.48 | 48423.77 | 11.35 | 33.71 |
| Gold | 45033.98 | 26110.24 | 8.52 | 72.48 |
| Machinery, electrical & non-electrical | 36392.76 | 26570.80 | 6.57 | 36.97 |
| Pearls, precious & Semi-precious stones | 27595.98 | 16340.69 | 5.79 | 68.88 |
| Organic & Inorganic Chemicals | 27498.42 | 17722.78 | 4.43 | 55.16 |
| Coal, Coke & Briquettes, etc. | 27120.61 | 14538.79 | 5.20 | 86.54 |
| Artificial resins, plastic materials, etc. | 18238.74 | 11790.09 | 3.10 | 54.70 |
| Transport equipment | 18211.83 | 16438.43 | 2.22 | 10.79 |
| Vegetable Oil | 17240.22 | 10012.30 | 2.47 | 72.19 |
| Total of 10 Major Commodity Groups | 423564.98 | 260360.38 | 77.00 | 62.68 |
| Rest | 126552.82 | 85176.63 | 23.00 | 48.58 |
| Total Imports | 550117.80 | 345537.01 | 100.00 | 59.21 |
Source: DGCI&S

