

Loading...

Top
Help
×

By creating an account you can:

Logo TaxTMI
Call Us / Help / Feedback

Contact Us At :

E-mail: [email protected]

Call / WhatsApp at: +91 99117 96707

For more information, Check Contact Us

FAQs :

To know Frequently Asked Questions, Check FAQs

Most Asked Video Tutorials :

For more tutorials, Check Video Tutorials

Submit Feedback/Suggestion :

Email :
Please provide your email address so we can follow up on your feedback.
Category :
Description :
Min 15 characters 0/2000
Make Most of Text Search
  1. Checkout this video tutorial: How to search effectively on TaxTMI.
  2. Put words in double quotes for exact word search, eg: "income tax"
  3. Avoid noise words such as : 'and, of, the, a'
  4. Sort by Relevance to get the most relevant document.
  5. Press Enter to add multiple terms/multiple phrases, and then click on Search to Search.
  6. Text Search
  7. The system will try to fetch results that contains ALL your words.
  8. Once you add keywords, you'll see a new 'Search In' filter that makes your results even more precise.
  9. Text Search
Add to...
You have not created any category. Kindly create one to bookmark this item!
Create New Category
Hide
Title :
Description :
❮❮ Hide
Default View
Expand ❯❯
Close ✕
🔎 News - Adv. Search
TEXT SEARCH:

Press 'Enter' to add multiple search terms. Rules for Better Search

Search In:
Main Text + AI Text
  • Main Text
  • Main Text + AI Text
  • AI Text
Category: ?
Categorized by AI
---- All Categories ----
  • ---- All Categories ----
  • Income Tax
  • GST
  • Customs, DGFT & SEZ
  • FEMA & RBI
  • Corp. Laws, SEBI & IBC
  • PMLA, Black Money & ED
  • Budget
  • News and Press Release
  • PTI News
Month:
---- All Months ----
  • ---- All Months ----
  • January
  • February
  • March
  • April
  • May
  • June
  • July
  • August
  • September
  • October
  • November
  • December
Year:
---- All Years ----
  • ---- All Years ----
  • 2026
  • 2025
  • 2024
  • 2023
  • 2022
  • 2021
  • 2020
  • 2019
  • 2018
  • 2017
  • 2016
  • 2015
  • 2014
  • 2013
  • 2012
  • 2011
Sort By: ?
In Sort By 'Default', exact matches for text search are shown at the top, followed by the remaining results in their regular order.
Relevance Default Date
    Kerala to stop welfare pension delivery through cooperative banks, shifts to DBT
    China's exports slow slightly in July despite robust demand for high-tech products
    India successfully concludes the Tenth BRICS Industry Ministers' Meeting in Jaipur under its BRICS Chairship 2026
    APEDA Organises BIOFACH INDIA 2026 to Promote India's Certified Organic Products and Expand Global Market Access
    RBI bars banks from disabling mobile devices of defaulting borrowers
    Par panel for early conclusion of India-US trade pact, tariff exemptions on key goods
    No commitments relating to ethanol import from US for fuel blending under FTA talks: Govt
    No concession or commitment on import of Ethanol for fuel blending from the United States
    Office of the Controller General of Patents, Designs and Trade Marks Announces Tentative Schedule for Patent and Trade Marks Agent Examinations 2027 a...
    RBI invites comments on the draft “Reserve Bank of India (Non-Banking Financial Companies – Credit Facilities) Amendment Directions, 2026”
    West Bengal seeks 100pc foodgrain, 40pc sugar jute packaging quota at SAC meeting
    RBI clasifies Tata Sons, 16 others as large NBFCs
    Sensex climbs 374 points on buying in Reliance, ICICI Bank; Nifty ends flat
    Insurance Division, DFS Secures 3rd Rank in Group A Category of Grievance Redressal Assessment & Index (GRAI) for June 2026
    VKDL Group’s NPA Bazaar Strengthens India’s Distressed Asset Resolution Ecosystem Under the Leadership of V K Dubey
    Lok Sabha passes bill to authorise govt to permit banks to levy charges on UPI transactions
    Monetary Policy Statement, 2026-27 Resolution of the Monetary Policy Committee August 3 to 5, 2026
    Stock markets edged higher in early trade amid lower crude oil prices, buying in Reliance Industries
    Monthly review of accounts of Government of India upto June 2026 (FY 2026-27)
    DRI busts illegal drug manufacturing unit in Satara district in Maharashtra; two arrested
❯❯
Maximize Maximize Maximize
0 / 200
Expand Note
Add to Folder

No Folders have been created

+

Are you sure you want to delete "My most important" ?

NOTE:

News
Showing Results for :
Reset Filters
Results Found:
Show All Summaries Hide All Summaries
August 7, 2026
Show AI Summary
Direct Benefit Transfer for welfare pensions replaces doorstep cooperative-bank delivery, while home delivery remains for bedridden beneficiaries.
Direct Benefit Transfer of social security and welfare pensions is to be made mandatory through Aadhaar-linked bank accounts, replacing cooperative-bank doorstep distribution. Home delivery continues for completely bedridden beneficiaries and others who cannot be excluded. The change addresses delays in remitting undistributed amounts, record-update and reconciliation deficiencies, duplicate payments linked to incomplete Aadhaar-based payments, delivery incentive costs, and the need to comply with Direct Benefit Transfer norms to avoid loss of central financial assistance.
August 7, 2026
Show AI Summary
Customs trade data show moderating July growth while high-technology exports, vehicles and advanced manufacturing supplies remain strongly supported.
Customs and trade data showed that China's July export and import growth moderated and its trade surplus narrowed from the preceding month. Typhoon-related port disruptions affected trade flows, but demand for electronics and green technology products supported elevated values. High-technology items, vehicles, electronics and machinery recorded strong January-July export growth, while trade performance varied among the United States, the European Union and Southeast Asia.
August 7, 2026
Show AI Summary
BRICS industrial cooperation advances MSME, photovoltaic, startup and logistics frameworks alongside resilient trade and digital services collaboration.
BRICS industrial cooperation under PartNIR was strengthened through a Joint Declaration and institutional measures addressing MSMEs, photovoltaics, startup-led innovation, and resilient transport and logistics. The measures include an SME cooperation framework, Terms of Reference and an Action Plan for photovoltaic industry cooperation, and a startup innovation action plan. Trade discussions focused on the multilateral trading system, MSME participation in international trade, resilient global value chains, and cross-border digitally delivered services within a rules-based trading framework.
August 7, 2026
Show AI Summary
Certified organic export promotion: BIOFACH INDIA facilitates buyer-seller engagement, certification awareness, traceability discussions and international market access.
BIOFACH INDIA 2026 promotes certified organic exports by providing a platform for Indian organic enterprises to showcase diverse certified products and engage with overseas buyers through structured Buyer-Seller Meets. Technical sessions address organic certification, traceability, sustainability, quality standards, international regulatory requirements and export-market expectations. The initiative supports quality assurance, international market access, export linkages and sustainable agricultural practices across the organic value chain.
August 6, 2026
Show AI Summary
Device-based loan recovery restrictions protect essential mobile functions while permitting gradual locking only for lender-financed devices.
Technology-based recovery mechanisms cannot restrict or disable a borrower's mobile device unless the bank financed acquisition of that device. Where permitted, banks must adopt a gradual approach and preserve essential functions, including incoming calls, SMS access, and emergency SOS features. Regulated entities and service providers must obtain manufacturer or operating-system certification for device-locking technology. Disclosure of borrower or guarantor information to recovery personnel must be limited to what is necessary for loan-recovery duties.
August 6, 2026
Show AI Summary
Bilateral trade agreement negotiations should secure tariff certainty, protect key exports, strengthen supply chains, and support vulnerable small industries.
An early Bilateral Trade Agreement is proposed to protect Indian interests, secure tariff exemptions for key exports, reduce barriers affecting industrial products, and create predictable trade conditions. Recommended measures include financial and export-credit support for small industries, real-time monitoring of customs requirements, documentation assistance, and timely policy support against tariff and non-tariff barriers. Export strategy should develop knowledge services and critical supply-chain integration, while a National Fund should assist suppliers with redesign, tooling, certification and entry into new global supply chains.
August 6, 2026
Show AI Summary
Ethanol imports for fuel blending remain excluded from trade commitments, with domestic producers continuing to supply the blending programme.
Ethanol imports for fuel blending remain outside concessions or commitments in India-US trade discussions. Under the Ethanol Blended with Petrol Programme, ethanol procurement is governed solely by domestic policy requirements and is sourced entirely from domestic producers. Claims of existing or intended large-scale ethanol imports from the United States for fuel blending, or of a policy change permitting them, are stated to be baseless.
August 6, 2026
Show AI Summary
Domestic ethanol sourcing for fuel blending continues unchanged, with no import commitments or concessions involving United States ethanol.
Ethanol used for fuel blending under the Ethanol Blended with Petrol Programme is sourced entirely from domestic producers, with no imports from the United States for that purpose. No concessions or commitments on importing United States ethanol for fuel blending have been made in trade discussions. Fuel blending and ethanol procurement continue to be governed solely by domestic policy requirements, and claims of a policy change allowing large-scale imports are incorrect.
August 6, 2026
Show AI Summary
Patent and trade marks agent qualification examinations require written-paper minimums, aggregate passing scores, and viva voce assessment for registration.
Patent and trade marks agent examinations comprise an objective Paper I, a descriptive Paper II and a viva voce assessing suitability to practise before the Intellectual Property Office. Candidates must secure the stipulated minimum marks in each written paper and the required aggregate score to pass. Registration in the relevant Register of Patent Agents or Register of Trade Marks Agents is available only to candidates who satisfy all prescribed eligibility conditions and qualify the examination.
August 6, 2026
Show AI Summary
Draft NBFC credit-facilities amendments open for stakeholder consultation through designated online and email feedback channels.
Draft amendments to the Non-Banking Financial Companies credit-facilities framework have been released for public consultation. Regulated entities and other interested stakeholders may submit comments or feedback through the 'Connect 2 Regulate' platform or by email using the specified subject line.
August 6, 2026
Show AI Summary
Mandatory jute packaging reservations were urged to protect cultivators, mill workers, crop absorption, and environmentally sustainable packaging.
Mandatory jute packaging reservations were sought to be retained at full coverage for foodgrains and increased for sugar packaging for the forthcoming Jute Year. The submission before the Standing Advisory Committee emphasised absorption of bumper jute output, remunerative prices for cultivators, uninterrupted mill operations, and protection of farm and worker livelihoods. It also stressed that biodegradable jute bags offer an environmentally friendly alternative to HDPE and polypropylene woven sacks, and that dilution of compulsory packaging could undermine plastic-pollution reduction efforts.
August 6, 2026
Show AI Summary
NBFC Upper Layer classification imposes enhanced regulation and listing obligations, while de-registration applications remain under examination.
NBFC Upper Layer classification subjects identified large non-banking financial companies to enhanced regulatory requirements for at least five years and requires stock-exchange listing within three years of identification. The framework divides NBFCs into Base, Middle, Upper and Top Layers. Seventeen large NBFCs were included in the Upper Layer list, while Tata Sons' classification remains subject to the pending examination of its de-registration application.
August 6, 2026
Show AI Summary
Closing auction price discovery may affect benchmark levels differently based on constituent liquidity and concentrated institutional order flow.
The Closing Auction Session in the equity cash segment uses an auction-based method to determine closing prices of eligible shares with futures and options contracts, aiming to strengthen transparent and robust price discovery. Its effect on benchmark closing levels may differ according to constituent liquidity and institutional order flow. The Reserve Bank of India retained the policy repo rate and neutral stance, indicating that future policy decisions will be data-dependent and influenced by assessment of energy-cost effects on inflation.
August 6, 2026
Show AI Summary
Public grievance redressal strengthens through monitoring, senior review, workshops, stakeholder coordination, and customer-centric service delivery improvements.
Public grievance redressal is assessed through the Grievance Redressal Assessment and Index, which analyses grievance categories and disposal. The Department of Financial Services' Insurance and Banking Divisions received third and sixth ranks respectively in the June 2026 assessment. Its framework includes disposal of grievances, random reviews by senior officials, and workshops on effective grievance redressal, supporting best practices, stakeholder coordination, technology use, customer-centric service, and accountable public service delivery.
August 6, 2026
Show AI Summary
Distressed asset resolution integrates restructuring, insolvency advisory, funding facilitation and digital marketplaces for transparent financial recovery transactions.
The platform provides integrated advisory, management and transaction-facilitation services for Non-Performing Assets, stressed assets and distressed assets. Its services include NPA resolution, debt restructuring, One-Time Settlements, funding assistance, insolvency and bankruptcy advisory, asset reconstruction, financial restructuring and capital raising. Digital and offline marketplaces facilitate transactions involving distressed assets, receivables and related movable or immovable properties, supported by collaborations with banks, Non-Banking Financial Companies, Asset Reconstruction Companies, corporates and investors.
August 6, 2026
Show AI Summary
Merchant discount rate framework may permit charges on notified UPI and digital payments through a government notification mechanism.
The proposed amendment to Section 10A of the Payment and Settlement Systems Act, 2007 replaces the existing income-tax-linked reference with a Central Government notification-based mechanism for electronic payment modes. It removes the current statutory restriction preventing banks and payment service providers from charging Merchant Discount Rate on notified modes, enabling the Government to permit charges for UPI and other digital payments. The policy rationale is to support funding for payment infrastructure and a sustainable revenue model for service providers.
August 6, 2026
Show AI Summary
Neutral monetary policy stance continues as resilient growth and food-fuel inflation risks require close macroeconomic monitoring.
The Monetary Policy Committee retained the policy repo rate and continued the neutral monetary policy stance, citing the need to assess evolving growth-inflation conditions. Domestic activity was assessed as resilient, supported by consumption, investment, credit, manufacturing, services and exports, although global uncertainty, energy prices, supply-chain pressures, geopolitical developments and monsoon conditions remain risks. CPI inflation increased mainly because of food and fuel pressures, while underlying inflation remained moderate. The Committee considered that price pressures were not yet generalised and reaffirmed its commitment to align inflation with the target.
August 6, 2026
Show AI Summary
Closing auction price discovery and a neutral monetary policy stance shaped equity market conditions amid lower crude prices.
The Closing Auction Session in the equity cash segment introduced an auction-based mechanism for determining closing prices of eligible shares with futures and options contracts, intended to make price discovery more transparent and robust. The Reserve Bank of India retained its neutral stance and left the benchmark policy rate unchanged, pending greater clarity on the inflationary effects of higher energy costs. Future policy decisions were stated to be data dependent.
August 6, 2026
Show AI Summary
Monthly public accounts review records receipts, expenditure, tax devolution, interest payments, subsidies, and capital spending through June.
Consolidated monthly accounts up to June 2026 report total receipts of Rs.10,49,243 crore, comprising net tax revenue, non-tax revenue and non-debt capital receipts. Tax devolution transfers to State Governments total Rs.2,63,336 crore. Total expenditure is Rs.13,57,076 crore, including revenue expenditure of Rs.10,16,818 crore and capital expenditure of Rs.3,40,258 crore. Revenue expenditure includes interest payments and major subsidies.
August 6, 2026
Show AI Summary
Illicit psychotropic drug manufacture triggered seizure, apprehensions, and investigation into planned trafficking under narcotics control law.
Illicit manufacture and trafficking of Alprazolam and Diazepam, psychotropic substances regulated under the Narcotic Drugs and Psychotropic Substances Act, 1985, were detected at a clandestine facility. Searches recovered finished and intermediary substances, together with raw materials and reaction mixtures used in manufacture, and the goods were seized under the Act. The manufacturer and an intended buyer were apprehended, with material indicating a proposed transaction for further illicit trafficking. Preliminary investigation indicated prior involvement in illegal drug production and trafficking.

News

Back

All News

Showing Results for :
Reset Filters
No Records Found

News

Back

All News

Showing Results for : Reset Filters
Customs, DGFT & SEZ

INDIA’S FOREIGN TRADE: December 2021

January 14, 2022

Contents
Summary
Note

Note

-

Bookmark

Print

Print

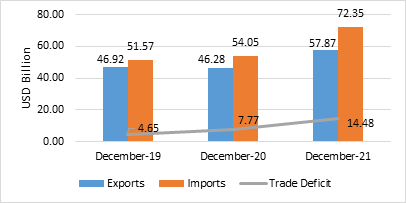
India’s overall exports (Merchandise and Services combined) in December 2021* are estimated to be USD 57.87 Billion, exhibiting a positive growth of 25.05 per cent over the same period last year and a positive growth of 23.35 per cent over December 2019. Overall imports in December 2021* are estimated to be USD 72.35 Billion, exhibiting a positive growth of 33.86 per cent over the same period last year and a positive growth of 40.30 per cent over December 2019

Table 1: Trade during December 2021*


December 2021

(USD Billion)

December 2020

(USD Billion)

December 2019

(USD Billion)

Growth vis-à-vis December 2020 (%)

Growth vis-à-vis December 2019 (%)

Merchandise

Exports

37.81

27.22

27.11

38.91

39.47

Imports

59.48

42.93

39.59

38.55

50.24

Trade Balance

-21.68

-15.72

-12.49

-37.92

-73.61

Services*

Exports

20.07

19.06

19.81

5.26

1.29

Imports

12.87

11.12

11.98

15.76

7.44

Net of Services

7.20

7.95

7.84

-9.42

-8.12

Overall Trade (Merchandise+

Services)*

Exports

57.87

46.28

46.92

25.05

23.35

Imports

72.35

54.05

51.57

33.86

40.30

Trade Balance

-14.48

-7.77

-4.65

-86.32

-211.26

* Note: The latest data for services sector released by RBI is for November 2021. The data for December 2021 is an estimation, which will be revised based on RBI’s subsequent release. (ii) Data for 2019, 2020 and April to September 2021 are revised on pro-rata basis using quarterly balance of payments data.

Fig 1: Overall Trade during December 2021*
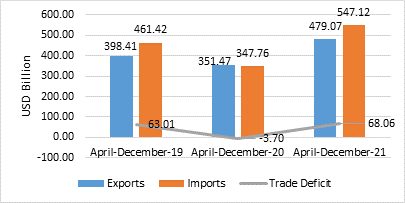
India’s overall exports (Merchandise and Services combined) in April-December 2021* are estimated to be USD 479.07 Billion, exhibiting a positive growth of 36.31 per cent over the same period last year and a positive growth of 20.25 per cent over April-December 2019. Overall imports in April-December 2021* are estimated to be USD 547.12 Billion, exhibiting a positive growth of 57.33 per cent over the same period last year and a positive growth of 18.57 per cent over April-December 2019.

Table 2: Trade during April-December 2021*


April-December 2021

(USD Billion)

April-December 2020

(USD Billion)

April-December 2019

(USD Billion)

Growth vis-à-vis April-December 2020 (%)

Growth vis-à-vis April-December 2019 (%)

Merchandise

Exports

301.38

201.38

238.27

49.66

26.49

Imports

443.82

262.76

364.18

68.91

21.87

Trade Balance

-142.44

-61.38

-125.91

-132.07

-13.13

Services*

Exports

177.68

150.09

160.13

18.39

10.96

Imports

103.30

85.00

97.24

21.52

6.23

Net of Services

74.39

65.08

62.90

14.30

18.27

Overall Trade (Merchandise+

Services)*

Exports

479.07

351.47

398.41

36.31

20.25

Imports

547.12

347.76

461.42

57.33

18.57

Trade Balance

-68.06

3.70

-63.01

-1937.96

-8.00

* Note: The latest data for services sector released by RBI is for November 2021. The data for December 2021 is an estimation, which will be revised based on RBI’s subsequent release. (ii) Data for 2019, 2020 and April to September 2021 are revised on pro-rata basis using quarterly balance of payments data.

Fig 2: Overall Trade during April-December 2021*
MERCHANDISE TRADE

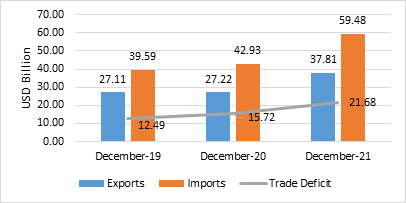
  • Merchandise exports in December 2021 were USD 37.81 Billion, as compared to USD 27.22 Billion in December 2020, exhibiting a positive growth of 38.91 per cent. As compared to December 2019, exports in December 2021 exhibited a positive growth of 39.47 per cent.
  • Merchandise imports in December 2021 were USD 59.48 Billion, which is an increase of 38.55 per cent over imports of USD 42.93 Billion in December 2020. Imports in December 2021 have registered a positive growth of 50.24 per cent in comparison to December 2019.
  • The merchandise trade balance for December 2021 was estimated at USD (-)  21.68 Billion as against USD (-) 15.72 Billion in December 2020, which is a decline of (-) 37.92 per cent. As compared to December 2019 (USD (-) 12.49 Billion), trade balance in December 2021 exhibited a negative growth of (-) 73.61 per cent.


Fig 3: Merchandise Trade during December 2021
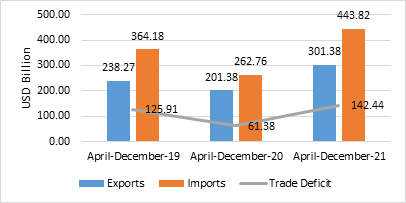
  • Merchandise exports for the period April-December 2021 was USD 301.38 Billion as against USD 201.38 Billion during the period April-December 2020, registering a positive growth of 49.66 per cent. As compared to April-December 2019, exports in April-December 2021 exhibited a positive growth of 26.49 per cent.
  • Merchandise imports for the period April-December 2021 was USD 443.82 Billion as against USD 262.76 Billion during the period April-December 2020, registering a positive growth of 68.91 per cent. Imports in April-December 2021 have registered a positive growth of 21.87 per cent in comparison to April-December 2019.
  • The merchandise trade balance for April-December 2021 was estimated at USD (-) 142.44 Billion as against USD (-) 61.38 Billion in April-December 2020, which is a decline of (-) 132.07 per cent. As compared to April-December 2019 (USD (-) 125.91 Billion), trade balance in April-December 2021 exhibited a negative growth of (-) 13.13 per cent.

Fig 4: Merchandise Trade during April- December 2021
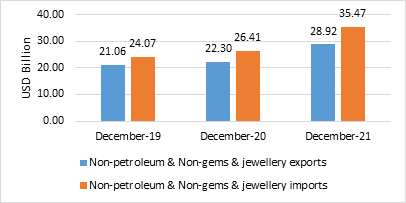
  • Non-petroleum and non-gems & jewellery exports in December 2021 were USD 28.92 Billion, registering a positive growth of 29.67 per cent over non-petroleum and non-gems & jewellery exports of USD 22.30 Billion in December 2020 and a positive growth of 37.31 per cent over non-petroleum and non-gems & jewellery exports of USD 21.06 Billion in December 2019. 
  • Non-petroleum, non-gems & jewellery (gold, silver & precious metals) imports were USD 35.47 Billion in December 2021 with a positive growth of 34.28 per cent over Non-petroleum, non-gems & jewellery imports of USD 26.41 Billion in December 2020 and a positive growth of 47.32 per cent over Non-petroleum, non-gems & jewellery imports of USD 24.07 Billion in December 2019.

Table 3: Trade excluding Petroleum and Gems & Jewellery during December 2021


December 2021

(USD Billion)

December 2020

(USD Billion)

December 2019

(USD Billion)

Growth vis-à-vis December 2020 (%)

Growth vis-à-vis December 2019 (%)

Non- petroleum exports

31.92

24.88

23.48

28.29

35.97

Non- petroleum imports

43.32

33.31

28.88

30.07

50.02

Non-petroleum & Non Gems & Jewellery exports

28.92

22.30

21.06

29.67

37.31

Non-petroleum & Non Gems & Jewellery imports*

35.47

26.41

24.07

34.28

47.32

Note: Gems & Jewellery Imports include Gold, Silver & Pearls, precious & Semi-precious stones

Fig 5: Trade excluding Petroleum and Gems & Jewellery during December 2021
 

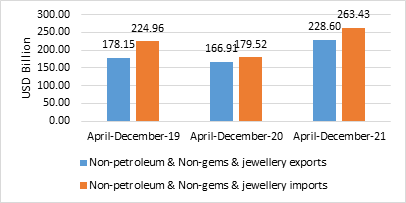
  • Non-petroleum and non-gems & jewellery exports during April-December 2021 was USD 228.60 Billion, an increase of 36.96 per cent over non-petroleum and non-gems & jewellery exports of USD 166.91 Billion in April-December 2020 and an increase of 28.32 per cent over non-petroleum and non-gems & jewellery exports of USD 178.15 Billion in April-December 2019.
  • Non-petroleum, non-gems & jewellery (gold, silver & precious metals) imports were USD 263.43 Billion in April-December 2021, recording a positive growth of 46.74 per cent, as compared to Non-petroleum, non-gems & jewellery imports of USD 179.52 Billion in April-December 2020 and a positive growth of 17.10 per cent over USD 224.96 Billion in April-December 2019.

Table 4: Trade excluding Petroleum and Gems & Jewellery during April-December 2021


April-December 2021

(USD Billion)

April-December 2020

(USD Billion)

April-December 2019

(USD Billion)

Growth vis-à-vis April-December 2020 (%)

Growth vis-à-vis April-December 2019 (%)

Non- petroleum exports

257.50

183.79

206.13

40.11

24.92

Non- petroleum imports

325.56

208.80

267.47

55.92

21.72

Non-petroleum & Non Gems & Jewellery exports

228.60

166.91

178.15

36.96

28.32

Non-petroleum & Non Gems & Jewellery imports*

263.43

179.52

224.96

46.74

17.10

Note: Gems & Jewellery Imports include Gold, Silver & Pearls, precious & Semi-precious stones

Fig 6: Trade excluding Petroleum and Gems & Jewellery during April-December 2021
SERVICES TRADE

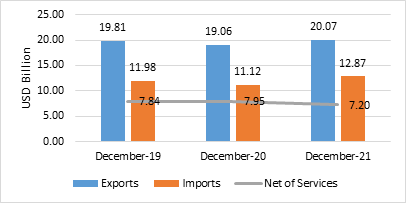
  • The estimated value of services export for December 2021* is USD 20.07 Billion, exhibiting a positive growth of 5.26 per cent vis-a-vis December 2020 (USD 19.06 Billion) and a positive growth of 1.29 per cent vis-à-vis December 2019 (USD 19.81 Billion).
  • The estimated value of services import for December 2021* is USD 12.87 Billion exhibiting a positive growth of 15.76 per cent vis-à-vis December 2020 (USD 11.12 Billion) and a positive growth of 7.44 per cent vis-à-vis December 2019 (USD 11.98 Billion).
  • The services trade balance in December 2021* is estimated at USD 7.20 Billion, which is a decline of (-) 9.42 per cent over December 2020 (USD 7.95 Billion) and a decline of (-) 8.12 per cent over December 2019 (USD 7.84 Billion).

Fig 7: Services Trade during December 2021*
  • The estimated value of services export for April-December 2021* is USD 177.68 Billion, exhibiting a positive growth of 18.39 per cent vis-a-vis April-December 2020 (USD 150.09 Billion) and a positive growth of 10.96 per cent vis-à-vis April-December 2019 (USD 160.13 Billion).
  • The estimated value of services imports for April-December 2021* is USD 103.30 Billion exhibiting a positive growth of 21.52 per cent vis-à-vis April-December 2020 (USD 85.00 Billion) and a positive growth of 6.23 per cent vis-à-vis April-December 2019 (USD 97.24 Billion).
  • The services trade balance for April-December 2021* was estimated at USD 74.39 Billion as against USD 65.08 Billion in April-December 2020, which is an increase of 14.30 per cent. As compared to April-December 2019 (USD 62.90 Billion), net of services in April-December 2021* exhibited a positive growth of 18.27 per cent. 

Fig 8: Services Trade during April-December 2021*
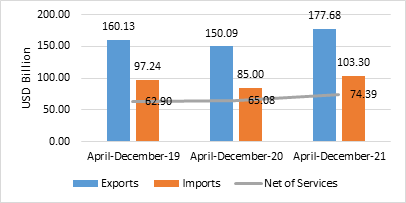
 

Table 5: Export Growth in Commodity Groups in December 2021

Sl. No.

Commodities

(Values in Million USD)

% Change

DEC'20

DEC'21

DEC'21


Commodity groups exhibiting positive growth

1

Petroleum Products

2336.63

5887.67

151.97

2

Coffee

44.00

98.47

123.80

3

Mica, Coal & Other Ores, Minerals including processed minerals

337.08

539.23

59.97

4

Plastic & Linoleum

570.49

899.85

57.73

5

Cotton Yarn/Fabs./made-ups, Handloom Products etc.

987.76

1443.98

46.19

6

Other cereals

96.24

140.17

45.65

7

Engineering Goods

7072.63

9788.88

38.41

8

Man-made Yarn/Fabs./made-ups etc.

380.52

518.22

36.19

9

Electronic Goods

1248.33

1672.59

33.99

10

Rice

682.77

895.08

31.10

11

Marine Products

562.85

720.51

28.01

12

Organic & Inorganic Chemicals

2100.00

2664.15

26.86

13

RMG of all Textiles

1195.78

1466.43

22.63

14

Fruits & Vegetables

190.07

227.53

19.71

15

Leather & leather products

338.49

404.41

19.48

16

Meat, dairy & poultry products

335.53

396.89

18.29

17

Gems & Jewellery

2575.67

2997.44

16.38

18

Oil seeds

147.72

165.29

11.90

19

Jute Mfg. including Floor Covering

41.78

46.73

11.86

20

Handicrafts excl. handmade carpet

180.34

196.13

8.75

21

Cereal preparations & miscellaneous processed items

183.48

199.18

8.56

22

Carpet

156.08

166.14

6.45

23

Drugs & Pharmaceuticals

2203.53

2318.04

5.20

Sl. No.

Commodities

(Values in Million USD)

% Change

DEC'20

DEC'21

DEC'21


Commodity Groups exhibiting negative growth

24

Iron Ore

382.38

54.44

-85.76

25

Oil Meals

236.75

119.67

-49.45

26

Cashew

52.29

39.09

-25.24

27

Spices

344.92

314.40

-8.85

28

Tea

74.43

68.61

-7.82

29

Ceramic products & glassware

310.62

294.23

-5.28

30

Tobacco

82.88

82.13

-0.90

 Table 6: Import Growth in Commodity Groups in December 2021

Sl. No.

Commodities

(Values in Million USD)

% Change

DEC'20

DEC'21

DEC'21


Commodity Groups exhibiting positive growth

1

Silver

10.39

232.04

2133.30

2

Sulphur & Unroasted Iron Pyrites

19.69

69.95

255.26

3

Fertilisers, Crude & manufactured

632.38

1712.03

170.73

4

Newsprint

12.07

27.18

125.19

5

Pulp and Waste paper

75.53

164.25

117.46

6

Metaliferrous ores & other minerals

429.52

857.30

99.59

7

Organic & Inorganic Chemicals

1879.88

3253.17

73.05

8

Coal, Coke & Briquettes, etc.

1624.32

2803.09

72.57

9

Cotton Raw & Waste

30.58

52.73

72.43

10

Project goods

127.03

215.58

69.71

11

Petroleum, Crude & products

9629.01

16165.97

67.89

12

Leather & leather products

50.02

76.08

52.10

13

Vegetable Oil

1210.88

1827.33

50.91

14

Dyeing/tanning/colouring materials

281.04

402.57

43.24

15

Artificial resins, plastic materials, etc.

1434.57

1970.30

37.34

16

Iron & Steel

1265.30

1722.90

36.17

17

Non-ferrous metals

1303.56

1705.32

30.82

18

Electronic goods

5037.69

6427.30

27.58

19

Fruits & vegetables

240.36

305.64

27.16

20

Textile yarn Fabric, made-up articles

180.93

229.20

26.68

21

Pearls, precious & Semi-precious stones

2397.17

2891.13

20.61

22

Machinery, electrical & non-electrical

3149.33

3796.75

20.56

23

Medicinal & Pharmaceutical products

623.44

743.89

19.32

24

Wood &  Wood products

470.32

548.23

16.57

25

Professional instrument, Optical goods, etc.

467.38

511.74

9.49

26

Chemical material & products

876.78

942.36

7.48

27

Gold

4485.76

4729.47

5.43

28

Machine tools

347.52

363.26

4.53

Sl. No.

Commodities

(Values in Million USD)

% Change

DEC'20

DEC'21

DEC'21


Commodity Groups exhibiting negative growth

29

Pulses

294.61

189.65

-35.63

30

Transport equipment

2476.59

2306.43

-6.87

  Table 7: MERCHANDISE TRADE 

EXPORTS & IMPORTS: (Rs. Crore)

(PROVISIONAL)


DECEMBER

APRIL-DECEMBER

EXPORTS(including re-exports)


2019-20

1,92,984.47

16,77,370.97

2020-21

2,00,294.50

15,00,019.98

2021-22

2,84,960.74

22,38,821.02

%Growth 2021-22/ 2020-21

42.27

49.25

%Growth 2021-22/ 2019-20

47.66

33.47

IMPORTS


2019-20

2,81,880.86

25,62,539.91

2020-21

3,15,970.77

19,56,256.92

2021-22

4,48,352.86

32,98,494.98

%Growth 2021-22/ 2020-21

41.90

68.61

%Growth 2021-22/ 2019-20

59.06

28.72

TRADE BALANCE


2019-20

-88,896.39

-8,85,168.94

2020-21

-1,15,676.27

-4,56,236.94

2021-22

-1,63,392.12

-10,59,673.96

Table 8: SERVICES TRADE 

EXPORTS & IMPORTS (SERVICES) : (US $ Billion)


(PROVISIONAL)

November 2021

April-

November 2021

EXPORTS (Receipts)

20.14

157.62

IMPORTS (Payments)

12.59

90.43

TRADE BALANCE

7.55

67.19


EXPORTS & IMPORTS (SERVICES): (Rs. Crore)


(PROVISIONAL)

November 2021

April-

November 2021

EXPORTS (Receipts)

1,50,006.15

11,68,297.72

IMPORTS (Payments)

93,753.85

6,70,401.42


TRADE BALANCE

56,252.31

4,97,896.29

Source: RBI Press Release dated 4th January 2022


 * Link for quick estimates

***

Topics

Acts Income Tax