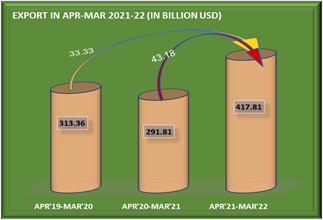
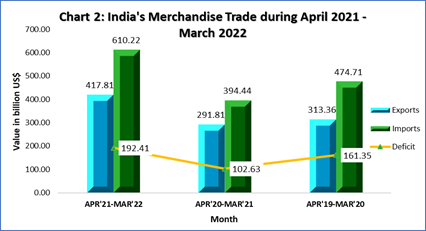
India achieves an all-time high annual merchandise exports, touching USD 417.81 billion in FY 2021-22, an increase of 43.18% over USD 291.81 billion in previous fiscal
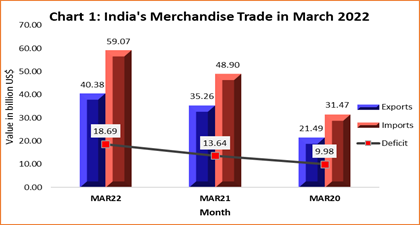
For the first time, monthly merchandise exports exceed USD 40 Billion, reaching USD 40.38 billion in March 2022, an increase of 14.53% over March 2021
INDIA’S MERCHANDISE TRADE: Preliminary Data March 2022
India achieved an all-time high annual merchandise exports of USD 417.81 billion in FY 2021-22, an increase of 43.18% over USD 291.81 billion in FY2020-21 and an increase of 33.33% over USD 313.36 billion in FY2019-20.
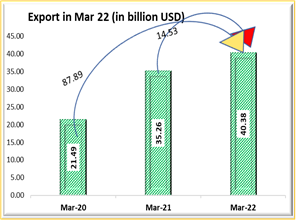
For the first time, India’s monthly merchandise exports exceeded USD 40 Billion, reaching USD 40.38 billion in March 2022, an increase of 14.53% over USD 35.26 billion in March 2021 and an increase of 87.89% over USD 21.49 billion in March 2020.
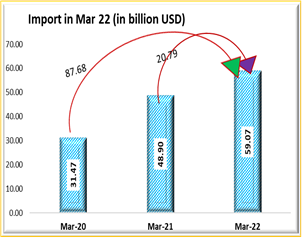
India’s merchandise import in March 2022 was USD 59.07 billion, an increase of 20.79% over USD 48.90 billion in March 2021 and an increase of 87.68% over USD 31.47 billion in March 2020.
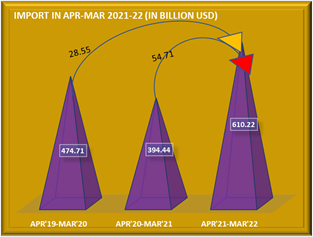
India’s merchandise import in April 2021-March 2022 was USD 610.22 billion, an increase of 54.71% over USD 394.44 billion in April 2020-March 2021 and an increase of 28.55% over USD 474.71 billion in April 2019-March 2020.
The trade deficit in March 2022 was USD 18.69 billion, while it was USD 192.41 billion during April 2021-March 2022.
Statement 1: India’s Total Trade in Merchandise goods in March2022 |
| Value in Billion USD | % Growth |
Mar-22 | Mar-21 | Mar-20 | Mar-22 over Mar-21 | Mar-22 over Mar-20 |
Exports | 40.38 | 35.26 | 21.49 | 14.53 | 87.89 |
Imports | 59.07 | 48.90 | 31.47 | 20.79 | 87.68 |
Deficit | 18.69 | 13.64 | 9.98 | 36.97 | 87.23 |
Statement 2: India’s Total Trade in Merchandise goods in Apr 2021-Mar2022 |
| Value in Billion USD | % Growth |
Apr21-Mar22 | Apr20-Mar21 | Apr19-Mar20 | Apr21-Mar22 over Apr20-Mar21 | Apr21-Mar22 over Apr19-Mar20 |
Exports | 417.81 | 291.81 | 313.36 | 43.18 | 33.33 |
Imports | 610.22 | 394.44 | 474.71 | 54.71 | 28.55 |
Deficit | 192.41 | 102.63 | 161.35 | 87.49 | 19.25 |
Value of non-petroleum exports in March 2022 was 33.00 USD billion, registering a positive growth of 4.28% over non-petroleum exports of USD 31.65 billion in March 2021 and a positive growth of 73.94% over non-petroleum exports of USD 18.97 billion in March 2020.
Value of non-petroleum imports was USD 40.66 billion in March 2022 with a positive growth of 5.26% over non-petroleum imports of USD 38.63 billion in March 2021 and a positive growth of 89.79% over non-petroleum imports of USD 21.42 billion in March 2020.
Statement 3: Merchandise Non-POL Trade in March 2022 |
| Value in Billion USD | % Growth |
| Mar-22 | Mar-21 | Mar-20 | Mar-22 over Mar-21 | Mar-22 over Mar-20 |
Exports | 33.00 | 31.65 | 18.97 | 4.28 | 73.94 |
Imports | 40.66 | 38.63 | 21.42 | 5.26 | 89.79 |
The cumulative value of non-petroleum exports in April 2021-March 2022 was USD 352.76 billion, an increase of 32.62% over USD 266.00 billion in April 2020-March 2021 and an increase of 29.66% over USD 272.07 billion in April 2019-March 2020.
The cumulative value of non-petroleum imports in April 2021-March 2022 was USD 449.54 billion, showing an increase of 44.2% compared to non-oil imports of USD 311.75 billion in April 2020-March 2021 and an increase of 30.62% compared to non-oil imports of USD 344.16 billion in April 2019-March 2020.
Statement 4: Merchandise Non-POL Trade Apr 2021-Mar 2022 |
| Value in Billion USD | % Growth |
| Apr21-Mar22 | Apr20-Mar21 | Apr19-Mar20 | Apr21-Mar22 over Apr20-Mar21 | Apr21-Mar22 over Apr19-Mar20 |
Exports | 352.76 | 266.00 | 272.07 | 32.62 | 29.66 |
Imports | 449.54 | 311.75 | 344.16 | 44.20 | 30.62 |
Value of non-petroleum and non-gems and jewellery exports in March 2022 was USD 29.38 billion, registering a positive growth of 4.79% over non-petroleum and non-gems and jewellery exports of USD 28.03 billion in March 2021 and a positive growth of 73.28% over non-petroleum and non-gems and jewellery exports of USD 16.95 billion in March 2020.
Value of non-oil, non-GJ (gold, silver & Precious metals) imports was USD 36.18 billion in March 2022 with a positive growth of 31.21% over non-oil and non-GJ imports of USD 27.58 billion in March 2021 and a positive growth of 93.52% over non-oil and non-GJ imports of USD 18.70 billion in March 2020.
Statement 5: Merchandise Non-POL Non-GJ Trade in March 2022 |
| Value in Billion USD | % Growth |
| Mar-22 | Mar-21 | Mar-20 | Mar-22 over Mar-21 | Mar-22 over Mar-20 |
Exports | 29.38 | 28.03 | 16.95 | 4.79 | 73.28 |
Imports | 36.18 | 27.58 | 18.70 | 31.21 | 93.52 |
The cumulative value of non-petroleum and non-gems and jewellery exports in April 2021-March 2022 was USD 313.82 billion, an increase of 30.77% over cumulative value of non-petroleum and non-gems and jewellery exports of USD 239.98 billion in April 2020-March 2021 and an increase of 32.88% over cumulative value of non-petroleum and non-gems and jewellery exports of USD 236.17 billion in April 2019-March 2020.
Non-oil, non-GJ (Gold, Silver & Precious Metals) imports was USD 369.19 billion in April 2021-March 2022, recording a positive growth of 43.39%, as compared to non-oil and non-GJ imports of USD 257.47 billion in April 2020-March 2021 and a positive growth of 26.98% over USD 290.74 billion in April 2019-March 2020.
Statement 6: Merchandise Non-POL Non-GJ Trade Apr 2021-Mar 2022 |
| Value in Billion USD | % Growth |
| Apr21-Mar22 | Apr20-Mar21 | Apr19-Mar20 | Apr21-Mar22 over Apr20-Mar21 | Apr21-Mar22 over Apr19-Mar20 |
Exports | 313.82 | 239.98 | 236.17 | 30.77 | 32.88 |
Imports | 369.19 | 257.47 | 290.74 | 43.39 | 26.98 |
Top 10 major commodity groups covering 81% of total exports in March 2022, are –
Statement 7: Exports of Top 10 Major Commodity Groups in March 2022 |
| | Value of Export (Million US$) | Share (%) | Growth (%) |
Major Commodity Group | Mar-22 | Mar-21 | Mar-22 | Mar-22 over Mar-21 |
Engineering goods | 10470.80 | 9298.36 | 25.93 | 12.61 |
Petroleum products | 7377.07 | 3609.36 | 18.27 | 104.39 |
Gems and Jewellery | 3624.34 | 3613.01 | 8.98 | 0.31 |
Organic and Inorganic chemicals | 2649.59 | 2288.87 | 6.56 | 15.76 |
Drugs and Pharmaceuticals | 2261.65 | 2295.05 | 5.60 | -1.46 |
Electronic goods | 1740.56 | 1400.67 | 4.31 | 24.27 |
RMG of all Textiles | 1661.50 | 1425.95 | 4.11 | 16.52 |
Cotton Yarn/Fabs./Madeups, Handloom products etc. | 1290.26 | 1105.05 | 3.20 | 16.76 |
Rice | 985.48 | 1116.54 | 2.44 | -11.74 |
Plastic and Linoleum | 811.53 | 719.54 | 2.01 | 12.78 |
Total of 10 Major Commodity Groups | 32872.78 | 26872.40 | 81.41 | 22.33 |
Rest | 7506.82 | 8384.20 | 18.59 | -10.46 |
Total Exports | 40379.59 | 35256.60 | 100.00 | 14.53 |
Top 10 major commodity groups covering 81% of total imports in March 2022, are –
Statement 8: Imports of Top 10 Major Commodity Groups in March 2022 |
| | Import (Million US$) | Share (%) | Growth (%) |
Major Commodity Group | Mar-22 | Mar-21 | Mar-22 | Mar-22 over Mar-21 |
Petroleum, Crude & products | 18406.97 | 10271.38 | 31.16 | 79.21 |
Electronic goods | 8293.79 | 5864.15 | 14.04 | 41.43 |
Coal, Coke & Briquettes, etc. | 4390.95 | 1735.74 | 7.43 | 152.97 |
Machinery, electrical & non-electrical | 3457.83 | 3513.68 | 5.85 | -1.59 |
Pearls, precious & Semi-precious stones | 3337.02 | 2547.27 | 5.65 | 31.00 |
Organic & Inorganic Chemicals | 2720.91 | 2102.57 | 4.61 | 29.41 |
Transport equipment | 1993.64 | 2210.75 | 3.38 | -9.82 |
Artificial resins, plastic materials, etc. | 1861.93 | 1719.92 | 3.15 | 8.26 |
Vegetable Oil | 1674.59 | 1076.81 | 2.84 | 55.51 |
Fertilisers, Crude & manufactured | 1615.96 | 204.16 | 2.74 | 691.50 |
Total of 10 Major Commodity Groups | 47753.59 | 31246.42 | 80.85 | 52.83 |
Rest | 11312.37 | 17652.44 | 19.15 | -35.92 |
Total Imports | 59065.96 | 48898.86 | 100.00 | 20.79 |
Top 10 major commodity groups covering 80% of total exports in April 2021-March 2022, are –
Statement 9: Exports of Top 10 Major Commodity Groups in April 2021-March 2022 |
| | Value of Export (Million US$) | Share (%) | Growth (%) |
Major Commodity Group | Apr21-Mar22 | Apr20-Mar21 | Apr21-Mar22 | Apr21-Mar22 over Apr20-Mar21 |
Engineering goods | 111632.94 | 76719.60 | 26.72 | 45.51 |
Petroleum products | 65044.80 | 25804.37 | 15.57 | 152.07 |
Gems and Jewellery | 38942.88 | 26022.82 | 9.32 | 49.65 |
Organic and Inorganic chemicals | 29152.67 | 22088.48 | 6.98 | 31.98 |
Drugs and Pharmaceuticals | 24475.36 | 24444.03 | 5.86 | 0.13 |
RMG of all Textiles | 15936.70 | 12272.21 | 3.81 | 29.86 |
Electronic goods | 15588.06 | 11093.29 | 3.73 | 40.52 |
Cotton Yarn/Fabs./Madeups, Handloom products etc. | 15244.20 | 9827.89 | 3.65 | 55.11 |
Plastic and Linoleum | 9783.35 | 7462.85 | 2.34 | 31.09 |
Rice | 9625.50 | 8829.21 | 2.30 | 9.02 |
Total of 10 Major Commodity Groups | 335426.46 | 224564.75 | 80.28 | 49.37 |
Rest | 82382.75 | 67243.73 | 19.72 | 22.51 |
Total Exports | 417809.21 | 291808.48 | 100.00 | 43.18 |
Top 10 major commodity groups covering 77% of total imports in April 2021-March 2022, are –
Statement 10: Imports of Top 10 Major Commodity Groups in April 2021-March 2022 |
| | Import (Million US$) | Share (%) | Growth (%) |
Major Commodity Group | Apr21-Mar22 | Apr20-Mar21 | Apr21-Mar22 | Apr21-Mar22 over Apr20-Mar21 |
Petroleum, Crude & products | 160683.24 | 82683.87 | 26.33 | 94.33 |
Electronic goods | 73067.90 | 54287.93 | 11.97 | 34.59 |
Gold | 46140.66 | 34603.92 | 7.56 | 33.34 |
Machinery, electrical & non-electrical | 39853.08 | 30084.48 | 6.53 | 32.47 |
Coal, Coke & Briquettes, etc. | 31514.97 | 16274.53 | 5.16 | 93.65 |
Pearls, precious & Semi-precious stones | 30927.82 | 18887.96 | 5.07 | 63.74 |
Organic & Inorganic Chemicals | 30222.86 | 19825.35 | 4.95 | 52.45 |
Transport equipment | 20206.07 | 18649.18 | 3.31 | 8.35 |
Artificial resins, plastic materials, etc. | 20104.96 | 13510.01 | 3.29 | 48.82 |
Vegetable Oil | 18931.51 | 11089.11 | 3.10 | 70.72 |
Total of 10 Major Commodity Groups | 471653.07 | 299896.33 | 77.29 | 57.27 |
Rest | 138568.35 | 94539.54 | 22.71 | 46.57 |
Total Imports | 610221.42 | 394435.87 | 100.00 | 54.71 |
Merchandise exports reach a record high, boosting export growth while imports expand and the trade deficit widens. India's merchandise exports reached a record annual high in FY 2021-22 with monthly exports surpassing the forty billion dollar mark for the first time; non petroleum and non POL non GJ exports expanded significantly while imports-led by petroleum, electronic goods, coal, machinery and precious metals-grew sharply, producing a widened monthly and annual trade deficit. The top ten commodity groups accounted for roughly 77-81% of total trade, highlighting concentrated sectoral contributions to the export and import performance.

