Login
Just a moment...
Press 'Enter' to add multiple search terms. Rules for Better Search
Press 'Enter' after typing page number.
Press 'Enter' after typing page number.
No Folders have been created
Are you sure you want to delete "My most important" ?
NOTE:
Press 'Enter' after typing page number.
Press 'Enter' after typing page number.
All News
Press 'Enter' after typing page number.
Press 'Enter' after typing page number.
All News
Note
Bookmark
Share
Don't have an account? Register Here
The cumulative value of merchandise exports during April-May 2026-27 was US$ 88.91 Billion, as compared to US$ 76.59 Billion during April-May 2025-26, registering a positive growth of 16.09%
The cumulative Non-Petroleum exports in April-May 2026-27 valued at US$ 70.74 Billion registered an increase of 10.49% as compared to US$ 64.03 Billion in April-May 2025-26
Major drivers of merchandise exports growth in May 2026 include Petroleum Products, Engineering Goods, Organic & Inorganic Chemicals, Electronic Goods, and Gems & Jewellery
Petroleum Products exports increased by 54.89% from US$ 5.44 Billion in May 2025 to US$ 8.42 Billion in May 2026
Engineering Goods exports increased by 24.48% from US$ 9.89 Billion in May 2025 to US$ 12.31 Billion in May 2026
Organic & Inorganic Chemicals exports increased by 12.71% from US$ 2.41 Billion in May 2025 to US$ 2.72 Billion in May 2026
Electronic Goods exports increased by 11.62% from US$ 4.57 Billion in May 2025 to US$ 5.10 Billion in May 2026
Gems & Jewellery exports increased by 6.66% from US$ 2.38 Billion in May 2025 to US$ 2.53 Billion in May 2026
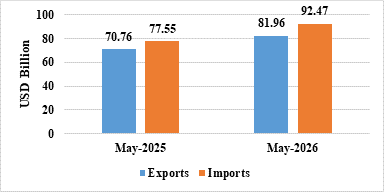
India’s total exports (Merchandise and Services combined) for May 2026* is estimated at US$ 81.96 Billion, registering a positive growth of 15.83 percent vis-à-vis May 2025. Total imports (Merchandise and Services combined) for May 2026* is estimated at US$ 92.47 Billion, registering a positive growth of 19.23 percent vis-à-vis May 2025.
Table 1: Trade during May 2026*
|
| May 2026 (US$ Billion) | May 2025 (US$ Billion) |
Merchandise | Exports | 45.20 | 38.30 |
Imports | 73.41 | 60.86 | |
Services* | Exports | 36.76 | 32.46 |
Imports | 19.06 | 16.70 | |
Total Trade (Merchandise +Services) * | Exports | 81.96 | 70.76 |
Imports | 92.47 | 77.55 | |
Trade Balance | -10.51 | -6.79 |
* Note: The latest data for services sector released by RBI is for April 2026. The data for May 2026 is an estimation. (ii) Data for April-May 2025-26 and April-December 2025 has been revised on pro-rata basis using quarterly balance of payments data.
Fig 1: Total Trade during May 2026*
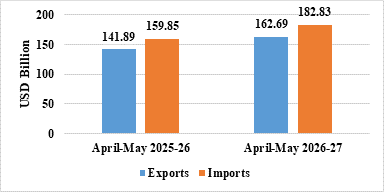
India’s total exports during April-May 2026-27* is estimated at US$ 162.69 Billion registering a positive growth of 14.66 percent. Total imports during April-May 2026-27* is estimated at US$ 182.83 Billion registering a growth of 14.38 percent.
Table 2: Trade during April-May 2026-27*
|
| April-May 2026-27 (US$ Billion) | April-May 2025-26 (US$ Billion) |
Merchandise | Exports | 88.91 | 76.59 |
Imports | 145.35 | 126.24 | |
Services* | Exports | 73.79 | 65.30 |
Imports | 37.48 | 33.61 | |
Total Trade (Merchandise +Services) * | Exports | 162.69 | 141.89 |
Imports | 182.83 | 159.85 | |
Trade Balance | -20.13 | -17.96 |
Fig 2: Total Trade during April-May 2026-27*
MERCHANDISE TRADE
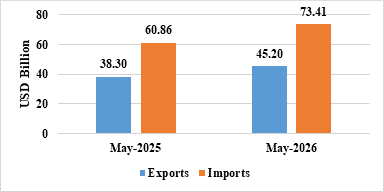
Merchandise exports during May 2026 were US$ 45.20 Billion as compared to US$ 38.30 Billion in May 2025.
Merchandise imports during May 2026 were US$ 73.41 Billion as compared to US$ 60.86 Billion in May 2025.
Fig 3: Merchandise Trade during May 2026
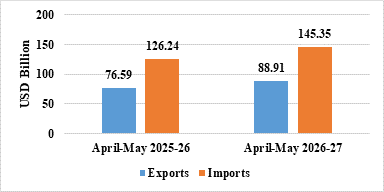
Merchandise exports during April-May 2026-27 were US$ 88.91 Billion as compared to US$ 76.59 Billion during April-May 2025-26.
Merchandise imports during April-May 2026-27 were US$ 145.35 Billion as compared to US$ 126.24 Billion during April-May 2025-26.
Merchandise trade deficit during April-May 2026-27 was US$ 56.44 Billion as compared to US$ 49.65 Billion during April-May 2025-26.
Fig 4: Merchandise Trade during April-May 2026-27
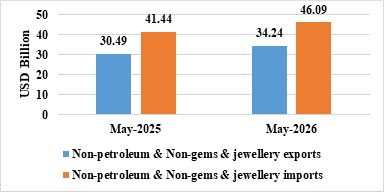
Non-petroleum and non-gems & jewellery exports in May 2026 were US$ 34.24 Billion compared to US$ 30.49 Billion in May 2025.
Non-petroleum, non-gems & jewellery (gold, silver & precious metals) imports in May 2026 were US$ 46.09 Billion compared to US$ 41.44 Billion in May 2025.
Table 3: Trade excluding Petroleum and Gems & Jewellery during May 2026
| May 2026 (US$ Billion) | May 2025 (US$ Billion) |
Non- petroleum exports | 36.78 | 32.87 |
Non- petroleum imports | 50.73 | 46.11 |
Non-petroleum & Non-Gems & Jewellery exports | 34.24 | 30.49 |
Non-petroleum & Non-Gems & Jewellery imports | 46.09 | 41.44 |
Note: Gems & Jewellery Imports include Gold, Silver & Pearls, precious & Semi-precious stones
Fig 5: Trade excluding Petroleum and Gems & Jewellery during May 2026
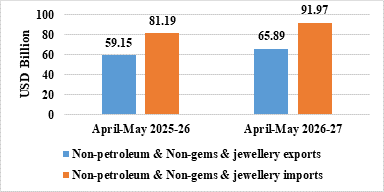
Non-petroleum and non-gems & jewellery exports in April-May 2026-27 were US$ 65.89 Billion, compared to US$ 59.15 Billion in April-May 2025-26.
Non-petroleum, non-gems & jewellery (gold, silver & precious metals) imports in April-May 2026-27 were US$ 91.97 Billion, compared to US$ 81.19 Billion in April-May 2025-26.
Table 4: Trade excluding Petroleum and Gems & Jewellery during April-May 2026-27
| April-May 2026-27 (US$ Billion) | April-May 2025-26 (US$ Billion) |
Non- petroleum exports | 70.74 | 64.03 |
Non- petroleum imports | 104.05 | 90.79 |
Non-petroleum & Non Gems & Jewellery exports | 65.89 | 59.15 |
Non-petroleum & Non Gems & Jewellery imports | 91.97 | 81.19 |
Note: Gems & Jewellery Imports include Gold, Silver & Pearls, precious & Semi-precious stones
Fig 6: Trade excluding Petroleum and Gems & Jewellery during April-May 2026-27
SERVICES TRADE
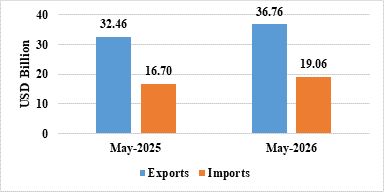
The estimated value of services export for May 2026* is US$ 36.76 Billion as compared to US$ 32.46 Billion in May 2025.
The estimated value of services imports for May 2026* is US$ 19.06 Billion as compared to US$ 16.70 Billion in May 2025.
Fig 7: Services Trade during May 2026*
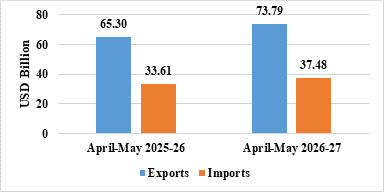
The estimated value of service exports during April-May 2026-27* is US$ 73.79 Billion as compared to US$ 65.30 Billion in April-May 2025-26.
The estimated value of service imports during April-May 2026-27* is US$ 37.48 Billion as compared to US$ 33.61 Billion in April-May 2025-26.
The services trade surplus for April-May 2026-27* is US$ 36.31 Billion as compared to US$ 31.69 Billion in April-May 2025-26.
Fig 8: Services Trade during April-May 2026-27*
Exports of Other Cereals (262.73%), Petroleum Products (54.89%), Meat, Dairy & Poultry Products (42.51%), Oil Meals (24.61%), Engineering Goods (24.48%), Handicrafts Excl. Hand Made Carpet (23.85%), Plastic & Linoleum (21.82%), Iron Ore (14.76%), Organic & Inorganic Chemicals (12.71%), Electronic Goods (11.62%), Gems & Jewellery (6.66%), Drugs & Pharmaceuticals (6.13%), Rice (5.38%), Cereal Preparations & Miscellaneous Processed Items (4.4%), Coffee (4.37%), and Cotton Yarn/Fabs./Made-Ups, Handloom Products Etc. (1.89%) record positive growth during May 2026 over the corresponding month of last year.
Imports of Silver (-86.65%), Project Goods (-64.05%), Chemical Material & Products (-63.58%), Pearls, Precious & Semi-Precious Stones (-26.5%), Iron & Steel (-12.47%), Pulp And Waste Paper (-9.93%), Machine Tools (-8.14%), Newsprint (-6.69%), Textile Yarn Fabric, Made-Up Articles (-3.68%), and Wood & Wood Products (-3.65%) record negative growth during May 2026 over the corresponding month of last year.
Services exports is estimated to grow by 12.99 percent during April-May 2026-27* over April-May 2025-26.
Top 5 export destinations, in terms of change in value, exhibiting positive growth in May 2026 vis a vis May 2025 are Singapore (68.96%), South Africa (116.21%), Tanzania Rep (196.89%), Italy (87.54%), and Sri Lanka Dsr (150.29%).
Top 5 export destinations, in terms of change in value, exhibiting positive growth in April-May 2026-27 vis a vis April-May 2025-26 are Singapore (123.75%), Tanzania Rep (172.22%), Sri Lanka Dsr (183.32%), South Africa (62.24%), and China P Rp (25.85%).
Top 5 import sources, in terms of change in value, exhibiting growth in May 2026 vis a vis May 2025 are Russia (63.46%), China P Rp (23.4%), U S A (54.43%), Oman (305.66%), and Brazil (358.83%).
Top 5 import sources, in terms of change in value, exhibiting growth in April-May 2026-27 vis a vis April-May 2025-26 are Russia (40.02%), China P Rp (22.15%), Oman (277.63%), U S A (19.4%), and Brazil (180.35%).
Press 'Enter' after typing page number.