Login
Just a moment...
Press 'Enter' to add multiple search terms. Rules for Better Search
Press 'Enter' after typing page number.
Press 'Enter' after typing page number.
No Folders have been created
Are you sure you want to delete "My most important" ?
NOTE:
Press 'Enter' after typing page number.
Press 'Enter' after typing page number.
All News
Press 'Enter' after typing page number.
Press 'Enter' after typing page number.
All News
Note
Bookmark
Share
Don't have an account? Register Here
Sustained momentum in rural consumption continues as urban-rural gap
narrows down further in 2023-24 from the level of 2022-23
Introduction
The Ministry of Statistics and Programme Implementation (MoSPI) decided to conduct two consecutive surveys on household consumption expenditure during 2022-23 and 2023-24, once situation normalized after the Covid-19 pandemic. The first survey was conducted during the period August 2022 to July 2023 and the summary results of the survey in the form of a factsheet was released in February 2024. Subsequently, the detailed report and the unit level data of the survey was released in June 2024.
The fieldwork of the second survey on the subject has been undertaken during August 2023 to July 2024 throughout the entire country. The summary results of the Household Consumption Expenditure Survey: 2023-24 (HCES:2023-24) has been prepared at state and broad item groups level and is being released in the form of a factsheet. The factsheet of HCES:2023-24 is available in the website of the Ministry (https://www.mospi.gov.in).
HCES is designed to collect information on consumption and expenditure of the households on goods and services. The survey provides data required to assess trends in economic well-being and to determine and update the basket of consumer goods and services and weights used for the calculation of the Consumer Price Index. Data collected in HCES is also used to measure poverty, inequality, and social exclusion. The Monthly Per Capita Consumption Expenditure (MPCE) compiled from HCES is the primary indicator used for most analytical purposes.
The estimates of MPCE of 2023-24 are based on the data collected from 2,61,953 Households (1,54,357 in rural areas and 1,07,596 in urban areas) in the central sample spread over all States and Union Territories in the country. As in HCES:2022-23, in HCES:2023-24 also two sets of estimates of MPCE have been generated: (i) without considering imputed values of items received free of cost by the households through various social welfare programmes and (ii) considering imputed values of items received free of cost by the households through various social welfare programmes. The first set of estimates are presented in Section A while the second ones are presented in Section B[i].
Important Findings of HCES: 2023-24
A Estimates of MPCE (without considering imputed values of items received free of cost through various social welfare programmes in HCES:2023-24)
The values of average MPCE for HCES:2023-24, HCES:2022-23 (for both without considering the imputed values of the items received free of cost through social transfer) and NSS 68th (2011-12) rounds at all-India level at current prices and at 2011-12 prices are given in Table 1 below:
Table 1: Average MPCE (Rs.) at current Prices and 2011-12 prices | |||||
Survey | Period | at current Prices | at 2011-12 Prices | ||
Rural | Urban | Rural | Urban | ||
HCES: 2023-24 | Aug 2023- Jul 2024 | 4,122 | 6,996 | 2,079 | 3,632 |
HCES: 2022-23 | Aug 2022- Jul 2023 | 3,773 | 6,459 | 2,008 | 3,510 |
68th round (2011-12) | Jul 2011-Jun 2012 | 1,430 | 2,630 | 1,430 | 2,630 |
Variation in MPCE across fractiles classes
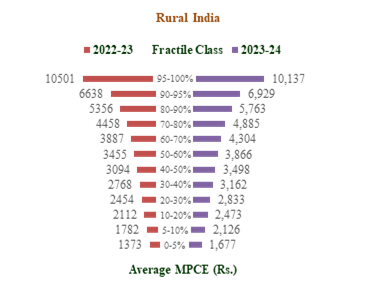
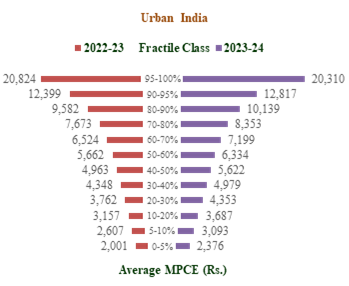
Besides, the all-India average MPCE, average MPCE over fractile classes of MPCE compiled from the data collected in HCES: 2023-24 at current prices are shown below in Figure 1. For any fraction f (0<f<1), the corresponding fractile of the distribution of MPCE (Y) is the level of MPCE, say, Yf such that the proportion of population whose household MPCE lies below Yf is f.
The bottom 5% of India’s rural population, ranked by MPCE, has an average MPCE of Rs. 1,677 while it is Rs. 2,376 for the same category of population in the urban areas.
The top 5% of India’s rural and urban population, ranked by MPCE, has an average MPCE of Rs. 10,137 and Rs. 20,310, respectively.
Average MPCE in 2023-24 has increased the most (22%) from the level of 2022-23 for the bottom 5% of India’s rural population when ranked by MPCE and for the corresponding segment of urban population the growth has been about 19% during the same period.
Figure 1: Average MPCE value for different fractile classes of MPCE | |
|
|
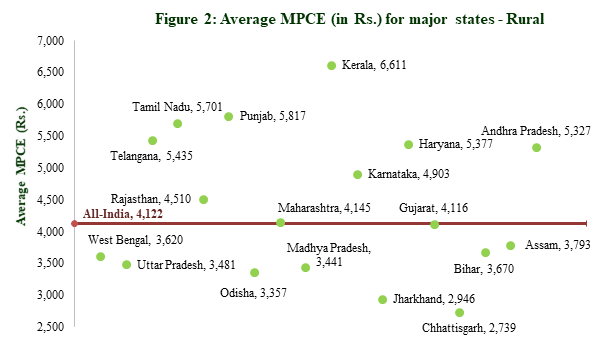
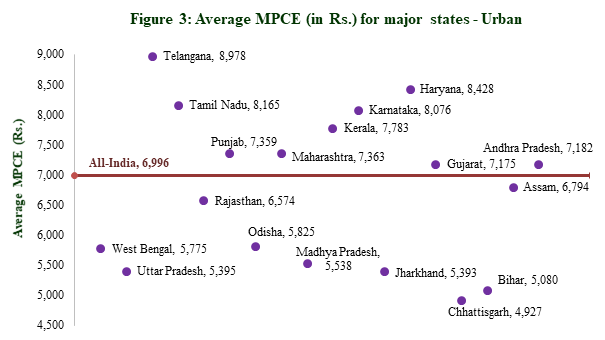
Variation in MPCE among the States and Union Territories
Among the States, MPCE is the highest in Sikkim (Rural – Rs. 9,377 and Urban – Rs. 13,927) and it is the lowest in Chhattisgarh (Rural – Rs. 2,739 and Urban – Rs. 4,927).
Among the UTs, MPCE is the highest in Chandigarh (Rural – Rs. 8,857 and Urban – Rs. 13,425), whereas it is the lowest in Dadra and Nagar Haveli and Daman and Diu (Rs. 4,311) and Jammu and Kashmir (Rs. 6,327) in rural and urban areas, respectively.
The rural-urban difference in average MPCE among the states is the highest in Meghalaya (104%) followed by Jharkhand (83%) and Chhattisgarh (80%).
Average MPCE in 9 out of 18 major states is higher than the all-India average MPCE in both rural and urban areas.
The relative position of major states in terms of MPCE with regard to all-India MPCE is shown in Figures 2 & 3.
Consumption Behavior of the Indian Households
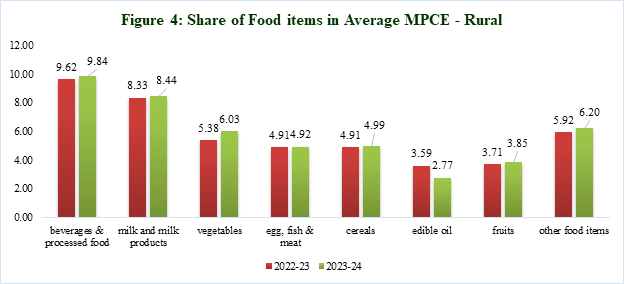
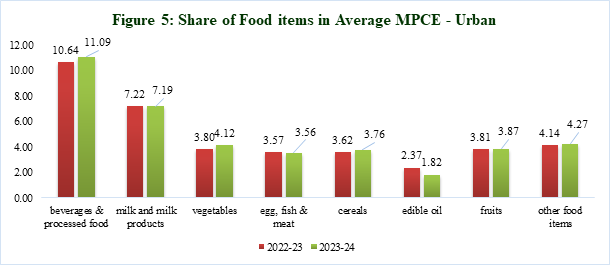
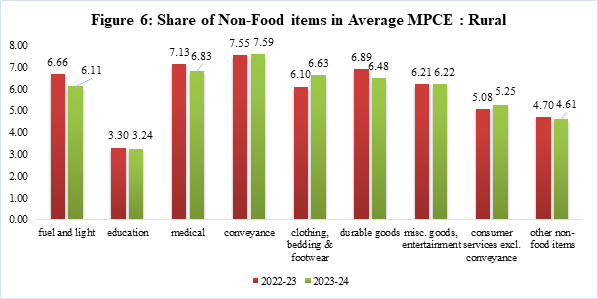
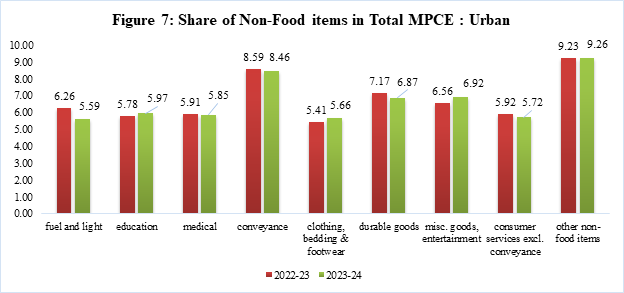
Across all the States and UTs, the households are observed to spend more on non-food items with share of non-food items in average MPCE being 53% and 60% in rural and urban areas, respectively. The major contributors in the non-food expenditure of the households in 2023-24 have been: (i) Conveyance, (ii) clothing, bedding & footwear, (iii) miscellaneous goods & entertainment and (iv) durable goods durable goods. Rent with a share of around 7% is another major constituent of households’ non-food expenditure in urban India.
As in 2022-23, beverages and processed food continues to be the major contributor in total consumption expenditure of food items in 2023-24, followed by milk & milk products and vegetables. A comparison of contribution of different item categories in the total consumption expenditure of the households in rural and urban areas for 2022-23 and 2023-24 is shown in Figures 4, 5, 6 and 7.
The values of average MPCE for HCES:2023-24, HCES:2022-23 (for both considering imputed values of items received free of cost through social transfer) and NSS 68th (2011-12) rounds at all-India level at current prices and at 2011-12 prices are given in Table 2 below:
Table 2: Average MPCE with imputation (Rs.) at current Prices and 2011-12 prices | ||||||
Survey | Period | at current Prices | at 2011-12 Prices | |||
Rural | Urban | Rural | Urban | |||
HCES: 2023-24 | Aug 2023- Jul 2024 | 4,247 | 7,078 | 2,142 | 3,674 | |
HCES: 2022-23 | Aug 2022- Jul 2023 | 3,860 | 6,521 | 2,054 | 3,544 | |
68th round (2011-12) | Jul 2011-Jun 2012 | 1,430 | 2,630 | 1,430 | 2,630 | |
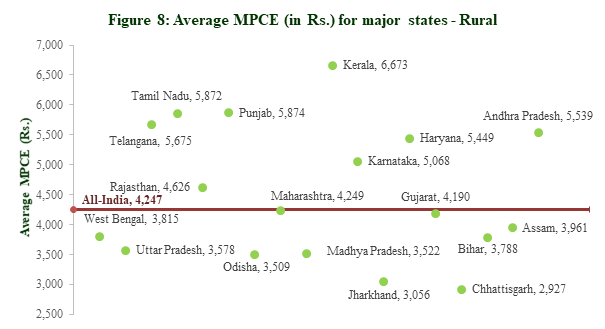
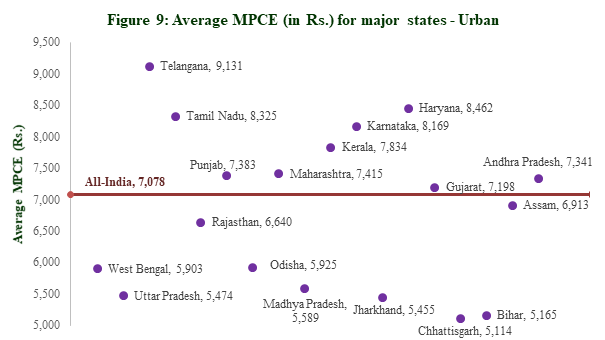
Variation in MPCE among the States and Union Territories
Among the States, MPCE (considering imputed values of items received free of cost through various social welfare programmes) is the highest in Sikkim (Rural – Rs. 9,474 and Urban – Rs. 13,965) and it is the lowest in Chhattisgarh (Rural – Rs. 2,927 and Urban – Rs. 5,114).
Among the UTs, MPCE is the highest in Chandigarh (Rural – Rs. 8,857 and Urban – Rs. 13,425), whereas it is the lowest in Dadra and Nagar Haveli and Daman and Diu (Rs. 4,450) and Jammu and Kashmir (Rs. 6,375) in rural and urban areas, respectively.
The relative position of major states in terms of MPCE with regard to all-India MPCE is shown in Figures 8 & 9.
[i] @ In HCES:2023-24, the usual practice of imputation of the value figures for consumption out of (i) home-grown/home-produced stock and (ii) gifts, loans, free collection and goods received in exchange of goods and services etc. has been continued; and accordingly, estimates of MPCE have been generated. These are presented in section A.
A provision for collection of information on the quantity of consumption for a number of items, received and consumed by the households free of cost through various social welfare programmes has been made in HCES:2022-23 and continued in HCES:2023-24. Consequently, the value figures for (i) food items: Rice, Wheat/Atta, Jowar, Bajra, Maize, Ragi, Barley, Small Millets, Pulses, Gram, Salt, Sugar, Edible Oil and (ii) non-food items: Laptop/PC, Tablet, Mobile Handset, Bicycle, Motor Cycle/Scooty, Clothing (school uniform), Footwear (school shoe etc.) received free of cost by the households through these programmes, have been imputed using an appropriate method. Accordingly, another set of estimates of MPCE considering imputed values of these items and of consumption out of home produce, free collection, gifts, loans etc. has also been compiled for HCES: 2023-24. These estimates are presented in Section B.
Pradhan Mantri Jan Aarogya Yojna (PM-JAY) or any other similar state specific schemes provide cashless access to health care services to the beneficiaries at the point of service delivery, i.e., the hospital and the beneficiary does not have any information on the cost of the services availed. For such schemes, entire premium is borne by the Government and the beneficiary makes no contribution. Since HCES is not a record-based survey, often it is not possible to ascertain the exact ailment or disease for which the benefit has been availed. Hence, in view of the complexity and appropriateness involved in imputation of the expenditure for such services, no attempt has been made to impute the expenditure of health services availed by the households free of cost.
For similar reasons, the expenditure for free education services (i.e., reimbursement/waiver of school or college fees) has also not been imputed.
Press 'Enter' after typing page number.