Login
 Generate professional replies, appeals, opinions to Show Cause Notices, assessment orders, audit objections, and other legal communications using TaxTMI's AI Drafter.
Just a moment...
Generate professional replies, appeals, opinions to Show Cause Notices, assessment orders, audit objections, and other legal communications using TaxTMI's AI Drafter.
Press 'Enter' to add multiple search terms. Rules for Better Search
Press 'Enter' after typing page number.
Press 'Enter' after typing page number.
No Folders have been created
Are you sure you want to delete "My most important" ?
NOTE:
Press 'Enter' after typing page number.
Press 'Enter' after typing page number.
All News
Press 'Enter' after typing page number.
Press 'Enter' after typing page number.
All News
Note
Bookmark
Share
Don't have an account? Register Here
I. Key highlights:
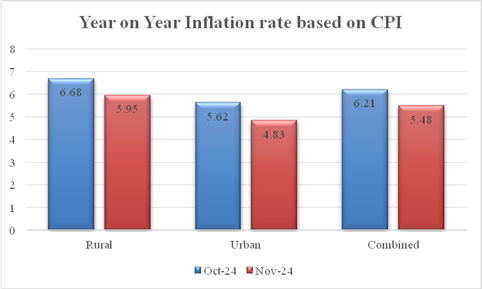
(i) Year-on-year inflation rate based on All India Consumer Price Index (CPI) for the month of November, 2024 over November, 2023 is 5.48% (Provisional). Corresponding inflation rates for rural and urban are 5.95% and 4.83%, respectively.
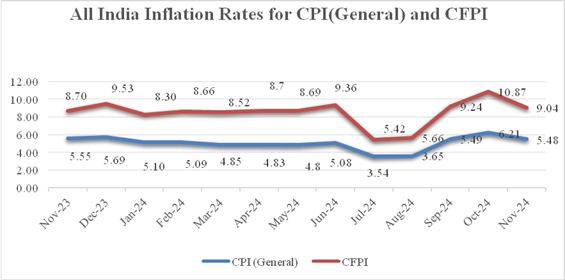
(ii) Year-on-year inflation rate based on All India Consumer Food Price Index (CFPI) for the month of November, 2024 over November, 2023 is 9.04% (Provisional). Corresponding inflation rate for rural and urban are 9.10% and 8.74%, respectively. All India inflation rates for CPI(General) and CFPI over the last 13 months are shown below. It can be observed that after December 2023, inflation rate for both CPI(General) and CFPI were declining, reaching their lowest point in July 2024. However, from August, 2024 to October. 2024, an increasing trend was observed. Thereafter, in November, 2024 inflation is again declined. The decline in inflation in November 2024 is mainly due to decline in inflation in “food & beverages” group.
(iii) Year-on-year Housing inflation rate for the month of November, 2024 is 2.87%. Corresponding inflation rate for the month of October, 2024 was 2.81%. The housing index is compiled for urban sector only.
(iv) During the month of November, 2024 significant decline in inflation is observed in Vegetables, Pulses & Products, Sugar & Confectionary, Fruits, Eggs, Milk and products, Spices, transport & communication and Personal care & effects subgroups.
(v) The top five items showing highest year on year Inflation at All India level in November 2024 are garlic (85.14), potato (66.65), cauliflower (47.70), cabbage (43.58) and coconut oil (42.13). The key items having lowest year on year inflation in November, 2024 are jeera (-35.04), ginger (-16.96), LPG-excluding conveyance (-10.24) and dry chillies (-9.73). For other data related to All India Item Index and Inflation, please visit the website www.cpi.mospi.gov.in
II. All India Inflation rates (on point to point basis i.e. current month over same month of last year, i.e. November 2024 over November 2023), based on General Indices and CFPIs are given as follows:
All India year-on-year inflation rates (%) based on CPI (General) and CFPI: November 2024 over
November 2023
| November 2024 (Prov.) | October 2024 (Final) | November 2023 | |||||||
Rural | Urban | Combd. | Rural | Urban | Combd. | Rural | Urban | Combd. | ||
Inflation | CPI (General) | 5.95 | 4.83 | 5.48 | 6.68 | 5.62 | 6.21 | 5.85 | 5.26 | 5.55 |
CFPI | 9.10 | 8.74 | 9.04 | 10.69 | 11.09 | 10.87 | 8.38 | 9.33 | 8.70 | |
Index | CPI (General) | 199.4 | 193.1 | 196.5 | 199.5 | 193.7 | 196.8 | 188.2 | 184.2 | 186.3 |
CFPI | 207.4 | 214.0 | 209.8 | 208.2 | 216.3 | 211.1 | 190.1 | 196.8 | 192.4 | |
Notes: Prov. – Provisional, Combd. – Combined
III. Monthly changes in the General Indices and CFPIs are given below:
Monthly changes (%) in All India CPI (General) and CFPI: November 2024 over October 2024
Indices | November 2024 (Prov.) | October 2024 (Final) | Monthly change (%) | ||||||
Rural | Urban | Combd. | Rural | Urban | Combd. | Rural | Urban | Combd. | |
CPI (General) | 199.4 | 193.1 | 196.5 | 199.5 | 193.7 | 196.8 | -0.05 | -0.31 | -0.15 |
CFPI | 207.4 | 214.0 | 209.8 | 208.2 | 216.3 | 211.1 | -0.38 | -1.06 | -0.62 |
Note: Figures of November 2024 are provisional.
IV. Response rate: The price data are collected from selected 1114 urban Markets and 1181 villages covering all States/UTs through personal visits by field staff of Field Operations Division of NSO, MoSPI on a weekly roster. During the month of November 2024, NSO collected prices from 99.8% villages and 98.5%urban markets while the market-wise prices reported therein were 88.8% for rural and 92.5 % for urban.
V. Next date of release for December 2024 CPI is 13th January 2025 (Monday). For more details, please visit the website www.cpi.mospi.gov.in or esankhyiki.mospi.gov.in
List of Annex
Annex | Title |
I | All-India General, Group and Sub-group level CPI and CFPI numbers for October 2024 (Final) and November 2024 (Provisional) for Rural, Urban and Combined (Annexure I) |
II | All-India inflation rates (%) for General, Group and Sub-group level CPI and CFPI numbers for November 2024 (Provisional) for Rural, Urban and Combined (Annexure II) |
III | General CPI for States for Rural, Urban and Combined for October 2024 (Final) and November 2024 (Provisional) (Annexure III) |
IV | Year-on-year inflation rates (%) of major States for Rural, Urban and Combined for November 2024 (Provisional) (Annexure IV) |
V | Time Series Data for All India General CPI (Base 2012 =100) Since January 2013 (Annexure V) |
VI | Time Series Data for All India Year-on-year inflation rates (%) based on General CPI (Base 2012=100) Since January 2014 (Annexure VI) |
Annex I
All-India General, Group and Sub-group level CPI and CFPI numbers for October 2024 (Final) and November 2024 (Provisional) for Rural, Urban and Combined
(Base: 2012=100)
Group Code | Sub-group Code | Description | Rural | Urban | Combined | ||||||
Weights | Oct 24 Index | Nov. 24 Index | Weights | Oct 24 Index | Nov. 24 Index | Weights | Oct 24 Index | Nov. 24 Index | |||
(1) | (2) | (3) | (4) | (5) | (6) | (7) | (8) | (9) | (10) | (11) | (12) |
| 1.1.01 | Cereals and products | 12.35 | 196.3 | 198.1 | 6.59 | 194.1 | 195.5 | 9.67 | 195.6 | 197.3 |
| 1.1.02 | Meat and fish | 4.38 | 221.6 | 220.9 | 2.73 | 230.5 | 229.8 | 3.61 | 224.7 | 224.0 |
| 1.1.03 | Egg | 0.49 | 194.1 | 199.3 | 0.36 | 199.0 | 204.7 | 0.43 | 196.0 | 201.4 |
| 1.1.04 | Milk and products | 7.72 | 186.9 | 187.2 | 5.33 | 187.9 | 187.8 | 6.61 | 187.3 | 187.4 |
| 1.1.05 | Oils and fats | 4.21 | 181.0 | 186.8 | 2.81 | 168.2 | 172.8 | 3.56 | 176.3 | 181.7 |
| 1.1.06 | Fruits | 2.88 | 192.5 | 190.7 | 2.90 | 196.1 | 193.8 | 2.89 | 194.2 | 192.1 |
| 1.1.07 | Vegetables | 7.46 | 270.5 | 259.9 | 4.41 | 333.9 | 315.2 | 6.04 | 292.0 | 278.7 |
| 1.1.08 | Pulses and products | 2.95 | 215.0 | 214.5 | 1.73 | 220.1 | 219.4 | 2.38 | 216.7 | 216.2 |
| 1.1.09 | Sugar and Confectionery | 1.70 | 131.3 | 131.1 | 0.97 | 133.0 | 133.2 | 1.36 | 131.9 | 131.8 |
| 1.1.10 | Spices | 3.11 | 229.7 | 230.0 | 1.79 | 225.0 | 224.3 | 2.50 | 228.1 | 228.1 |
| 1.2.11 | Non-alcoholic beverages | 1.37 | 185.4 | 186.0 | 1.13 | 174.0 | 174.8 | 1.26 | 180.6 | 181.3 |
| 1.1.12 | Prepared meals, snacks, sweets etc. | 5.56 | 199.6 | 200.5 | 5.54 | 210.2 | 210.8 | 5.55 | 204.5 | 205.3 |
1 |
| Food and beverages | 54.18 | 206.7 | 206.2 | 36.29 | 214.1 | 212.3 | 45.86 | 209.4 | 208.4 |
2 |
| Pan, tobacco and intoxicants | 3.26 | 207.4 | 208.1 | 1.36 | 213.5 | 212.2 | 2.38 | 209.0 | 209.2 |
| 3.1.01 | Clothing | 6.32 | 199.2 | 200.0 | 4.72 | 189.2 | 189.6 | 5.58 | 195.3 | 195.9 |
| 3.1.02 | Footwear | 1.04 | 192.9 | 193.4 | 0.85 | 175.2 | 175.4 | 0.95 | 185.5 | 185.9 |
3 |
| Clothing and footwear | 7.36 | 198.3 | 199.0 | 5.57 | 187.1 | 187.4 | 6.53 | 193.9 | 194.4 |
4 |
| Housing | - | - | - | 21.67 | 182.7 | 183.0 | 10.07 | 182.7 | 183.0 |
5 |
| Fuel and light | 7.94 | 181.1 | 180.8 | 5.58 | 169.7 | 169.6 | 6.84 | 176.8 | 176.6 |
| 6.1.01 | Household goods and services | 3.75 | 185.8 | 186.4 | 3.87 | 177.4 | 178.0 | 3.80 | 181.8 | 182.4 |
| 6.1.02 | Health | 6.83 | 198.6 | 199.3 | 4.81 | 193.6 | 194.0 | 5.89 | 196.7 | 197.3 |
| 6.1.03 | Transport and communication | 7.60 | 176.4 | 176.6 | 9.73 | 165.5 | 165.6 | 8.59 | 170.7 | 170.8 |
| 6.1.04 | Recreation and amusement | 1.37 | 180.4 | 181.0 | 2.04 | 176.0 | 176.4 | 1.68 | 177.9 | 178.4 |
| 6.1.05 | Education | 3.46 | 191.8 | 192.0 | 5.62 | 187.6 | 187.8 | 4.46 | 189.3 | 189.5 |
| 6.1.06 | Personal care and effects | 4.25 | 205.1 | 206.0 | 3.47 | 207.3 | 207.7 | 3.89 | 206.0 | 206.7 |
6 |
| Miscellaneous | 27.26 | 189.9 | 190.4 | 29.53 | 181.5 | 181.8 | 28.32 | 185.8 | 186.2 |
General Index (All Groups) | 100.00 | 199.5 | 199.4 | 100.00 | 193.7 | 193.1 | 100.00 | 196.8 | 196.5 | ||
Consumer Food Price Index (CFPI) | 47.25 | 208.2 | 207.4 | 29.62 | 216.3 | 214.0 | 39.06 | 211.1 | 209.8 | ||
Notes:
Annex II
All-India year-on-year inflation rates (%) for General, Group and Sub-group level CPI and CFPI numbers for November 2024 (Provisional) for Rural, Urban and Combined
(Base: 2012=100)
Group Code | Sub-group Code | Description | Rural | Urban | Combined | ||||||
Nov. 23 Index | Nov. 24 Index | Inflation Rate | Nov. 23 Index | Nov. 24 Index | Inflation Rate | Nov. 23 Index | Nov. 24 Index | Inflation Rate | |||
(1) | (2) | (3) | (4) | (5) | (6) | (7) | (8) | (9) | (10) | (11) | (12) |
1.1.01 | Cereals and products | 184.8 | 198.1 | 7.20 | 184.2 | 195.5 | 6.13 | 184.6 | 197.3 | 6.88 | |
1.1.02 | Meat and fish | 210.9 | 220.9 | 4.74 | 219.6 | 229.8 | 4.64 | 214.0 | 224.0 | 4.67 | |
1.1.03 | Egg | 190.4 | 199.3 | 4.67 | 194.8 | 204.7 | 5.08 | 192.1 | 201.4 | 4.84 | |
1.1.04 | Milk and products | 182.2 | 187.2 | 2.74 | 182.3 | 187.8 | 3.02 | 182.2 | 187.4 | 2.85 | |
1.1.05 | Oils and fats | 162.6 | 186.8 | 14.88 | 156.7 | 172.8 | 10.27 | 160.4 | 181.7 | 13.28 | |
1.1.06 | Fruits | 174.6 | 190.7 | 9.22 | 182.7 | 193.8 | 6.08 | 178.4 | 192.1 | 7.68 | |
1.1.07 | Vegetables | 199.9 | 259.9 | 30.02 | 246.0 | 315.2 | 28.13 | 215.5 | 278.7 | 29.33 | |
1.1.08 | Pulses and products | 202.9 | 214.5 | 5.72 | 209.3 | 219.4 | 4.83 | 205.1 | 216.2 | 5.41 | |
1.1.09 | Sugar and Confectionery | 129.7 | 131.1 | 1.08 | 130.9 | 133.2 | 1.76 | 130.1 | 131.8 | 1.31 | |
1.1.10 | Spices | 249.8 | 230.0 | -7.93 | 239.7 | 224.3 | -6.42 | 246.4 | 228.1 | -7.43 | |
1.2.11 | Non-alcoholic beverages | 181.8 | 186.0 | 2.31 | 169.0 | 174.8 | 3.43 | 176.5 | 181.3 | 2.72 | |
1.1.12 | Prepared meals, snacks, sweets etc. | 193.7 | 200.5 | 3.51 | 201.8 | 210.8 | 4.46 | 197.5 | 205.3 | 3.95 | |
1 | Food and beverages | 190.2 | 206.2 | 8.41 | 196.6 | 212.3 | 7.99 | 192.6 | 208.4 | 8.20 | |
2 | Pan, tobacco and intoxicants | 202.9 | 208.1 | 2.56 | 208.5 | 212.2 | 1.77 | 204.4 | 209.2 | 2.35 | |
3.1.01 | Clothing | 194.4 | 200.0 | 2.88 | 184.5 | 189.6 | 2.76 | 190.5 | 195.9 | 2.83 | |
3.1.02 | Footwear | 189.8 | 193.4 | 1.90 | 171.0 | 175.4 | 2.57 | 182.0 | 185.9 | 2.14 | |
3 | Clothing and footwear | 193.7 | 199.0 | 2.74 | 182.4 | 187.4 | 2.74 | 189.2 | 194.4 | 2.75 | |
4 | Housing | - | - | - | 177.9 | 183.0 | 2.87 | 177.9 | 183.0 | 2.87 | |
5 | Fuel and light | 182.4 | 180.8 | -0.88 | 175.8 | 169.6 | -3.53 | 179.9 | 176.6 | -1.83 | |
6.1.01 | Household goods and services | 182.0 | 186.4 | 2.42 | 172.3 | 178.0 | 3.31 | 177.4 | 182.4 | 2.82 | |
6.1.02 | Health | 191.9 | 199.3 | 3.86 | 186.2 | 194.0 | 4.19 | 189.7 | 197.3 | 4.01 | |
6.1.03 | Transport and communication | 171.7 | 176.6 | 2.85 | 161.7 | 165.6 | 2.41 | 166.4 | 170.8 | 2.64 | |
6.1.04 | Recreation and amusement | 176.4 | 181.0 | 2.61 | 171.8 | 176.4 | 2.68 | 173.8 | 178.4 | 2.65 | |
6.1.05 | Education | 185.2 | 192.0 | 3.67 | 180.4 | 187.8 | 4.10 | 182.4 | 189.5 | 3.89 | |
6.1.06 | Personal care and effects | 186.7 | 206.0 | 10.34 | 187.9 | 207.7 | 10.54 | 187.2 | 206.7 | 10.42 | |
6 | Miscellaneous | 182.5 | 190.4 | 4.33 | 174.4 | 181.8 | 4.24 | 178.6 | 186.2 | 4.26 | |
General Index (All Groups) | 188.2 | 199.4 | 5.95 | 184.2 | 193.1 | 4.83 | 186.3 | 196.5 | 5.48 | ||
Consumer Food Price Index | 190.1 | 207.4 | 9.10 | 196.8 | 214.0 | 8.74 | 192.4 | 209.8 | 9.04 | ||
Notes:
Annex III
General CPI for States for Rural, Urban and Combined for October 2024 (Final) and November 2024 (Provisional) (Base: 2012=100)
Sl. No. | Name of the State/UT | Rural | Urban | Combined | ||||||
Weights | Oct24 Index | Nov. 24 Index | Weights | Oct24 Index | Nov. 24 Index | Weights | Oct 24 Index | Nov. 24 Index | ||
(1) | (2) | (3) | (4) | (5) | (6) | (7) | (8) | (9) | (10) | (11) |
1 | Andhra Pradesh | 5.40 | 201.4 | 200.7 | 3.64 | 201.2 | 200.7 | 4.58 | 201.3 | 200.7 |
2 | Arunachal Pradesh | 0.14 | 199.5 | 200.7 | 0.06 | -- | -- | 0.10 | 199.5 | 200.7 |
3 | Assam | 2.63 | 200.8 | 199.6 | 0.79 | 196.9 | 197.7 | 1.77 | 200.0 | 199.2 |
4 | Bihar | 8.21 | 197.4 | 197.0 | 1.62 | 203.6 | 204.2 | 5.14 | 198.3 | 198.1 |
5 | Chhattisgarh | 1.68 | 194.5 | 195.4 | 1.22 | 188.3 | 187.6 | 1.46 | 192.1 | 192.4 |
6 | Delhi | 0.28 | 176.7 | 176.7 | 5.64 | 176.2 | 174.2 | 2.77 | 176.2 | 174.3 |
7 | Goa | 0.14 | 182.7 | 182.8 | 0.25 | 181.0 | 181.9 | 0.19 | 181.7 | 182.2 |
8 | Gujarat | 4.54 | 194.3 | 194.2 | 6.82 | 186.1 | 184.9 | 5.60 | 189.7 | 188.9 |
9 | Haryana | 3.30 | 202.6 | 200.9 | 3.35 | 187.8 | 186.1 | 3.32 | 195.7 | 194.0 |
10 | Himachal Pradesh | 1.03 | 184.1 | 183.6 | 0.26 | 188.5 | 188.2 | 0.67 | 184.9 | 184.4 |
11 | Jharkhand | 1.96 | 193.4 | 193.8 | 1.39 | 196.9 | 196.3 | 1.69 | 194.7 | 194.8 |
12 | Karnataka | 5.09 | 200.0 | 200.2 | 6.81 | 201.7 | 201.5 | 5.89 | 200.9 | 200.9 |
13 | Kerala | 5.50 | 202.3 | 203.5 | 3.46 | 198.3 | 198.9 | 4.55 | 200.9 | 201.9 |
14 | Madhya Pradesh | 4.93 | 198.2 | 198.3 | 3.97 | 197.7 | 198.1 | 4.48 | 198.0 | 198.2 |
15 | Maharashtra | 8.25 | 197.3 | 197.7 | 18.86 | 189.2 | 188.9 | 13.18 | 191.9 | 191.8 |
16 | Manipur | 0.23 | 235.1 | 239.2 | 0.12 | 193.3 | 195.1 | 0.18 | 221.9 | 225.2 |
17 | Meghalaya | 0.28 | 179.5 | 179.3 | 0.15 | 185.9 | 185.0 | 0.22 | 181.5 | 181.1 |
18 | Mizoram | 0.07 | 207.5 | 207.7 | 0.13 | 183.0 | 182.9 | 0.10 | 192.5 | 192.6 |
19 | Nagaland | 0.14 | 201.2 | 202.0 | 0.12 | 185.7 | 186.9 | 0.13 | 194.6 | 195.6 |
20 | Odisha | 2.93 | 205.2 | 205.0 | 1.31 | 193.1 | 192.5 | 2.18 | 201.8 | 201.5 |
21 | Punjab | 3.31 | 191.4 | 191.4 | 3.09 | 183.8 | 183.2 | 3.21 | 188.0 | 187.7 |
22 | Rajasthan | 6.63 | 195.5 | 194.8 | 4.23 | 193.0 | 192.4 | 5.51 | 194.6 | 193.9 |
23 | Sikkim | 0.06 | 205.7 | 205.8 | 0.03 | 190.8 | 191.1 | 0.05 | 200.8 | 201.0 |
24 | Tamil Nadu | 5.55 | 202.8 | 202.8 | 9.20 | 201.1 | 200.7 | 7.25 | 201.8 | 201.6 |
25 | Telangana | 3.16 | 211.1 | 210.6 | 4.41 | 203.8 | 202.8 | 3.74 | 207.1 | 206.3 |
26 | Tripura | 0.35 | 217.1 | 217.2 | 0.14 | 213.1 | 211.0 | 0.25 | 216.1 | 215.6 |
27 | Uttar Pradesh | 14.83 | 200.2 | 200.3 | 9.54 | 195.2 | 194.6 | 12.37 | 198.4 | 198.3 |
28 | Uttarakhand | 1.06 | 190.8 | 191.1 | 0.73 | 196.7 | 197.1 | 0.91 | 193.0 | 193.3 |
29 | West Bengal | 6.99 | 204.3 | 203.6 | 7.20 | 198.0 | 197.6 | 7.09 | 201.3 | 200.8 |
30 | Andaman & Nicobar Islands | 0.05 | 201.1 | 204.2 | 0.07 | 187.1 | 189.0 | 0.06 | 194.0 | 196.5 |
31 | Chandigarh | 0.02 | 195.8 | 196.8 | 0.34 | 182.4 | 181.8 | 0.17 | 183.2 | 182.7 |
32 | Dadra & Nagar Haveli | 0.02 | 184.8 | 185.0 | 0.04 | 191.3 | 190.8 | 0.03 | 189.1 | 188.9 |
33 | Daman & Diu | 0.02 | 202.0 | 203.5 | 0.02 | 191.0 | 191.0 | 0.02 | 197.4 | 198.3 |
34 | Jammu & Kashmir* | 1.14 | 204.9 | 205.7 | 0.72 | 200.2 | 200.7 | 0.94 | 203.2 | 203.9 |
35 | Lakshadweep | 0.01 | 203.0 | 199.5 | 0.01 | 186.0 | 188.1 | 0.01 | 194.3 | 193.7 |
36 | Puducherry | 0.08 | 209.7 | 210.5 | 0.27 | 198.8 | 199.1 | 0.17 | 201.6 | 202.0 |
All India | 100.00 | 199.5 | 199.4 | 100.00 | 193.7 | 193.1 | 100.00 | 196.8 | 196.5 | |
Notes:
and Ladakh (erstwhile State of Jammu & Kashmir).
Annex IV
Year-on-year inflation rates (%) of major@ States for Rural, Urban and Combined for November 2024 (Provisional)
(Base: 2012=100)
Sl. No. | Name of the State/UT | Rural | Urban | Combined | ||||||
Nov. 23 Index | Nov. 24 Index | Inflation Rate | Nov. 23 Index | Nov. 24 Index | Inflation Rate | Nov. 23 Index | Nov. 24 Index | Inflation Rate | ||
(1) | (2) | (3) | (4) | (5) | (6) | (7) | (8) | (9) | (10) | (11) |
1 | Andhra Pradesh | 190.8 | 200.7 | 5.19 | 191.6 | 200.7 | 4.75 | 191.1 | 200.7 | 5.02 |
2 | Assam | 189.8 | 199.6 | 5.16 | 187.9 | 197.7 | 5.22 | 189.4 | 199.2 | 5.17 |
3 | Bihar | 183.3 | 197.0 | 7.47 | 189.3 | 204.2 | 7.87 | 184.2 | 198.1 | 7.55 |
4 | Chhattisgarh | 178.2 | 195.4 | 9.65 | 176.4 | 187.6 | 6.35 | 177.5 | 192.4 | 8.39 |
5 | Delhi | 170.1 | 176.7 | 3.88 | 169.8 | 174.2 | 2.59 | 169.8 | 174.3 | 2.65 |
6 | Gujarat | 184.3 | 194.2 | 5.37 | 174.5 | 184.9 | 5.96 | 178.8 | 188.9 | 5.65 |
7 | Haryana | 189.5 | 200.9 | 6.02 | 178.1 | 186.1 | 4.49 | 184.2 | 194.0 | 5.32 |
8 | Himachal Pradesh | 174.5 | 183.6 | 5.21 | 179.2 | 188.2 | 5.02 | 175.4 | 184.4 | 5.13 |
9 | Jharkhand | 184.5 | 193.8 | 5.04 | 185.4 | 196.3 | 5.88 | 184.8 | 194.8 | 5.41 |
10 | Karnataka | 190.0 | 200.2 | 5.37 | 192.2 | 201.5 | 4.84 | 191.2 | 200.9 | 5.07 |
11 | Kerala | 190.1 | 203.5 | 7.05 | 189.4 | 198.9 | 5.02 | 189.9 | 201.9 | 6.32 |
12 | Madhya Pradesh | 185.5 | 198.3 | 6.90 | 189.0 | 198.1 | 4.81 | 186.9 | 198.2 | 6.05 |
13 | Maharashtra | 189.2 | 197.7 | 4.49 | 179.9 | 188.9 | 5.00 | 183.0 | 191.8 | 4.81 |
14 | Odisha | 190.8 | 205.0 | 7.44 | 183.2 | 192.5 | 5.08 | 188.7 | 201.5 | 6.78 |
15 | Punjab | 182.2 | 191.4 | 5.05 | 175.7 | 183.2 | 4.27 | 179.3 | 187.7 | 4.68 |
16 | Rajasthan | 185.7 | 194.8 | 4.90 | 184.0 | 192.4 | 4.57 | 185.1 | 193.9 | 4.75 |
17 | Tamil Nadu | 192.9 | 202.8 | 5.13 | 191.4 | 200.7 | 4.86 | 192.0 | 201.6 | 5.00 |
18 | Telangana | 200.8 | 210.6 | 4.88 | 195.5 | 202.8 | 3.73 | 197.9 | 206.3 | 4.24 |
19 | Uttar Pradesh | 186.7 | 200.3 | 7.28 | 185.0 | 194.6 | 5.19 | 186.1 | 198.3 | 6.56 |
20 | Uttarakhand | 181.9 | 191.1 | 5.06 | 186.1 | 197.1 | 5.91 | 183.5 | 193.3 | 5.34 |
21 | West Bengal | 193.3 | 203.6 | 5.33 | 188.9 | 197.6 | 4.61 | 191.2 | 200.8 | 5.02 |
22 | Jammu & Kashmir* | 193.9 | 205.7 | 6.09 | 193.6 | 200.7 | 3.67 | 193.8 | 203.9 | 5.21 |
All India | 188.2 | 199.4 | 5.95 | 184.2 | 193.1 | 4.83 | 186.3 | 196.5 | 5.48 | |
Notes:
Annexure V
Time Series Data for All India General CPI (Base 2012 =100) Since January 2013
Year | Jan | Feb | Mar | Apr | May | Jun | Jul | Aug | Sep | Oct | Nov | Dec |
2013 | 104.6 | 105.3 | 105.5 | 106.1 | 106.9 | 109.3 | 111.0 | 112.4 | 113.7 | 114.8 | 116.3 | 114.5 |
2014 | 113.6 | 113.6 | 114.2 | 115.1 | 115.8 | 116.7 | 119.2 | 120.3 | 120.1 | 120.1 | 120.1 | 119.4 |
2015 | 119.5 | 119.7 | 120.2 | 120.7 | 121.6 | 123.0 | 123.6 | 124.8 | 125.4 | 126.1 | 126.6 | 126.1 |
2016 | 126.3 | 126.0 | 126.0 | 127.3 | 128.6 | 130.1 | 131.1 | 131.1 | 130.9 | 131.4 | 131.2 | 130.4 |
2017 | 130.3 | 130.6 | 130.9 | 131.1 | 131.4 | 132.0 | 134.2 | 135.4 | 135.2 | 136.1 | 137.6 | 137.2 |
2018 | 136.9 | 136.4 | 136.5 | 137.1 | 137.8 | 138.5 | 139.8 | 140.4 | 140.2 | 140.7 | 140.8 | 140.1 |
2019 | 139.6 | 139.9 | 140.4 | 141.2 | 142.0 | 142.9 | 144.2 | 145.0 | 145.8 | 147.2 | 148.6 | 150.4 |
2020 | 150.2 | 149.1 | 148.6 | 151.4 | 150.9 | 151.8 | 153.9 | 154.7 | 156.4 | 158.4 | 158.9 | 157.3 |
2021 | 156.3 | 156.6 | 156.8 | 157.8 | 160.4 | 161.3 | 162.5 | 162.9 | 163.2 | 165.5 | 166.7 | 166.2 |
2022 | 165.7 | 166.1 | 167.7 | 170.1 | 171.7 | 172.6 | 173.4 | 174.3 | 175.3 | 176.7 | 176.5 | 175.7 |
2023 | 176.5 | 176.8 | 177.2 | 178.1 | 179.1 | 181.0 | 186.3 | 186.2 | 184.1 | 185.3 | 186.3 | 185.7 |
2024 | 185.5 | 185.8 | 185.8 | 186.7 | 187.7 | 190.2 | 193.0 | 193.0 | 194.2 | 196.8 | 196.5 |
|
Notes:
Annexure VI
Time Series Data for All India Year-on-year inflation rates (%) based on General CPI (Base 2012=100) Since January 2014
Year | Jan | Feb | Mar | Apr | May | Jun | Jul | Aug | Sep | Oct | Nov | Dec |
2014 | 8.60 | 7.88 | 8.25 | 8.48 | 8.33 | 6.77 | 7.39 | 7.03 | 5.63 | 4.62 | 3.27 | 4.28 |
2015 | 5.19 | 5.37 | 5.25 | 4.87 | 5.01 | 5.40 | 3.69 | 3.74 | 4.41 | 5.00 | 5.41 | 5.61 |
2016 | 5.69 | 5.26 | 4.83 | 5.47 | 5.76 | 5.77 | 6.07 | 5.05 | 4.39 | 4.20 | 3.63 | 3.41 |
2017 | 3.17 | 3.65 | 3.89 | 2.99 | 2.18 | 1.46 | 2.36 | 3.28 | 3.28 | 3.58 | 4.88 | 5.21 |
2018 | 5.07 | 4.44 | 4.28 | 4.58 | 4.87 | 4.92 | 4.17 | 3.69 | 3.70 | 3.38 | 2.33 | 2.11 |
2019 | 1.97 | 2.57 | 2.86 | 2.99 | 3.05 | 3.18 | 3.15 | 3.28 | 3.99 | 4.62 | 5.54 | 7.35 |
2020 | 7.59 | 6.58 | 5.84 | - | - | 6.23 | 6.73 | 6.69 | 7.27 | 7.61 | 6.93 | 4.59 |
2021 | 4.06 | 5.03 | 5.52 | 4.23 | 6.30 | 6.26 | 5.59 | 5.30 | 4.35 | 4.48 | 4.91 | 5.66 |
2022 | 6.01 | 6.07 | 6.95 | 7.79 | 7.04 | 7.01 | 6.71 | 7.00 | 7.41 | 6.77 | 5.88 | 5.72 |
2023 | 6.52 | 6.44 | 5.66 | 4.70 | 4.31 | 4.87 | 7.44 | 6.83 | 5.02 | 4.87 | 5.55 | 5.69 |
2024 | 5.10 | 5.09 | 4.85 | 4.83 | 4.80 | 5.08 | 3.60 | 3.65 | 5.49 | 6.21 | 5.48 |
|
Notes:
Press 'Enter' after typing page number.