The cumulative value of merchandise exports during April-August 2024 was USD 178.68 Billion, as compared to USD 176.67 Billion during April-August 2023, registering a positive growth of 1.14%.
Non-petroleum & Non-Gems & Jewellery exports registered an increase of 2.35% from USD 26.14 Billion in August 2023 to USD 26.76 Billion in August 2024.
Major drivers of merchandise exports growth in August 2024 include Engineering Goods, Organic & Inorganic Chemicals, Electronic Goods, RMG of all Textiles and Drugs & Pharmaceuticals
Engineering Goods exports increased by 4.36% from USD 9.05 Billion in August 2023 to USD 9.44 Billion in August 2024.
Organic & Inorganic Chemicals exports increased by 8.32% from USD 2.19 Billion in August 2023 to USD 2.37 Billion in August 2024.
Electronic Goods exports increased by 7.85% from USD 2.16 Billion in August 2023 to USD 2.33 Billion in August 2024.
RMG of all Textiles exports increased by 11.88% from USD 1.13 Billion in August 2023 to USD 1.27 Billion in August 2024.
Drugs & Pharmaceuticals exports increased by 4.67% from USD 2.24 Billion in August 2023 to USD 2.35 Billion in August 2024.
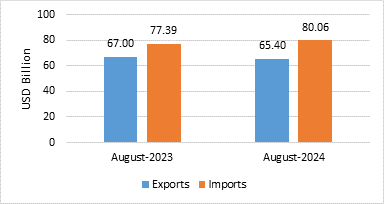
India’s total exports (Merchandise and Services combined) for August 2024* is estimated at USD 65.40 Billion, registering a negative growth of (-) 2.38 percent vis-à-vis August 2023. Total imports (Merchandise and Services combined) for August 2024* is estimated at USD 80.06 Billion, registering a positive growth of 3.45 percent vis-à-vis August 2023.
Table 1: Trade during August 2024*
| | August 2024 (USD Billion) | August 2023 (USD Billion) |
Merchandise | Exports | 34.71 | 38.28 |
Imports | 64.36 | 62.30 |
Services* | Exports | 30.69 | 28.71 |
Imports | 15.70 | 15.09 |
Total Trade (Merchandise +Services) * | Exports | 65.40 | 67.00 |
Imports | 80.06 | 77.39 |
Trade Balance | -14.66 | -10.39 |
* Note: The latest data for services sector released by RBI is for July 2024. The data for August 2024 is an estimation, which will be revised based on RBI’s subsequent release.
Fig 1: Total Trade during August 2024*
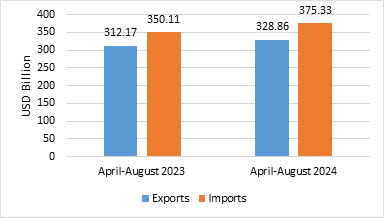
India’s total exports during April-August 2024* is estimated at USD 328.86 Billion registering a positive growth of 5.35 percent. Total imports during April-August 2024* is estimated at USD 375.33 Billion registering a growth of 7.20 percent.
Table 2: Trade during April-August 2024*
| | April-August 2024 (USD Billion) | April-August 2023 (USD Billion) |
Merchandise | Exports | 178.68 | 176.67 |
Imports | 295.32 | 275.83 |
Services* | Exports | 150.18 | 135.50 |
Imports | 80.00 | 74.28 |
Total Trade (Merchandise +Services) * | Exports | 328.86 | 312.17 |
Imports | 375.33 | 350.11 |
Trade Balance | -46.46 | -37.94 |
Fig 2: Total Trade during April-August 2024*
MERCHANDISE TRADE
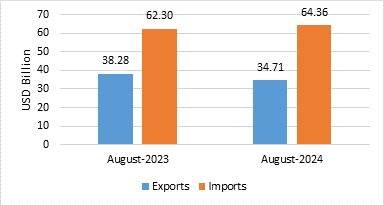
- Merchandise exports during August 2024 were USD 34.71 Billion as compared to USD 38.28 Billion in August 2023.
- Merchandise imports during August 2024 were USD 64.36 Billion as compared to USD 62.30 Billion in August 2023.
Fig 3: Merchandise Trade during August 2024
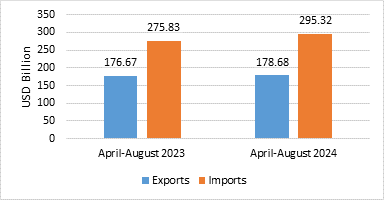
- Merchandise exports during April-August 2024 were USD 178.68 Billion as compared to USD 176.67 Billion during April-August 2023.
- Merchandise imports during April-August 2024 were USD 295.32 Billion compared to USD 275.83 Billion during April-August 2023.
- Merchandise trade deficit during April-August 2024 was USD 116.64 Billion compared to USD 99.16 Billion during April-August 2023.
Fig4: Merchandise Trade during April-August 2024
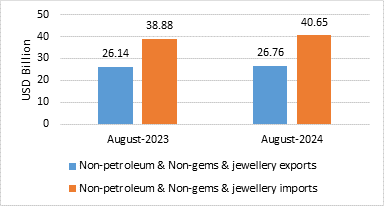
- Non-petroleum and non-gems & jewellery exports in August 2024 were USD 26.76 Billion compared to USD 26.14 Billion in August 2023.
- Non-petroleum, non-gems & jewellery (gold, silver & precious metals) imports in August 2024 were USD 40.65 Billion compared to USD 38.88 Billion in August 2023.
Table 3: Trade excluding Petroleum and Gems & Jewellery during August 2024
| August 2024 (USD Billion) | August 2023 (USD Billion) |
Non- petroleum exports | 28.76 | 28.74 |
Non- petroleum imports | 53.34 | 46.01 |
Non-petroleum & Non-Gems & Jewellery exports | 26.76 | 26.14 |
Non-petroleum & Non-Gems & Jewellery imports | 40.65 | 38.88 |
Note: Gems & Jewellery Imports include Gold, Silver & Pearls, precious & Semi-precious stones
Fig 5: Trade excluding Petroleum and Gems & Jewellery during August 2024
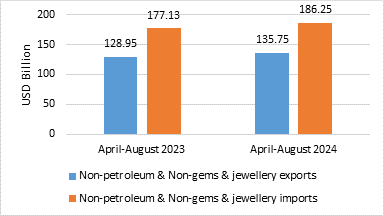
- Non-petroleum and non-gems & jewellery exports in April-August 2024 were USD 135.75 Billion, compared to USD 128.95 Billion in April-August 2023.
- Non-petroleum, non-gems & jewellery (gold, silver & precious metals) imports in April-August 2024 were USD 186.25 Billion, compared to USD 177.13 Billion in April-August 2023.
Table 4: Trade excluding Petroleum and Gems & Jewellery during April-August 2024
| April-August 2024 (USD Billion) | April-August 2023 (USD Billion) |
Non- petroleum exports | 146.85 | 141.38 |
Non- petroleum imports | 218.94 | 205.88 |
Non-petroleum & Non Gems & Jewellery exports | 135.75 | 128.95 |
Non-petroleum & Non Gems & Jewellery imports | 186.25 | 177.13 |
Note: Gems & Jewellery Imports include Gold, Silver & Pearls, precious & Semi-precious stones
Fig 6: Trade excluding Petroleum and Gems & Jewellery during April-August 2024
SERVICES TRADE
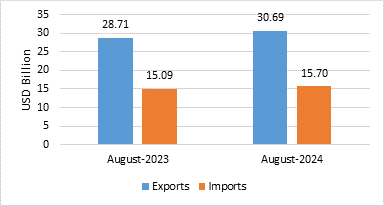
- The estimated value of services export for August 2024* is USD 30.69 Billion as compared to USD 28.71 Billion in August 2023.
- The estimated value of services imports for August 2024* is USD 15.70 Billion as compared to USD 15.09 Billion in August 2023.
Fig 7: Services Trade during August 2024*
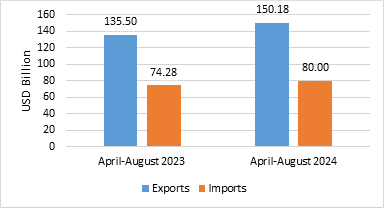
- The estimated value of service exports during April-August 2024* is USD 150.18 Billion as compared to USD 135.50 Billion in April-August 2023.
- The estimated value of service imports during April-August 2024* is USD 80 Billion as compared to USD 74.28 Billion in April-August 2023.
- The services trade surplus for April-August 2024* is USD 70.18 Billion as compared to USD 61.22 Billion in April-August 2023.
Fig 8: Services Trade during April-August 2024*
- Exports of Coffee (69.55%), Tobacco (34.45%), Spices (19.13%), Jute Mfg. Including Floor Covering (15.24%), Tea (14.96%), Rmg Of All Textiles (11.88%), Plastic & Linoleum (11.08%), Meat, Dairy & Poultry Products (9.83%), Carpet (8.9%), Organic & Inorganic Chemicals (8.32%), Oil Seeds (8.09%), Electronic Goods (7.85%), Cereal Preparations & Miscellaneous Processed Items (7.62%), Handicrafts Excl. Hand Made Carpet (7.19%), Cashew (6.84%), Drugs & Pharmaceuticals (4.67%), Engineering Goods (4.36%), Man-Made Yarn/Fabs./Made-Ups Etc. (1.59%) and Leather & Leather Products (0.07%) record positive growth during August 2024 over the corresponding month of last year.
- Imports of Dyeing/Tanning/Colouring Materials (-58.07%), Chemical Material & Products (-53.08%), Pearls, Precious & Semi-Precious Stones (-35.37%), Petroleum, Crude & Products (-32.38%), Sulphur & Unroasted Iron Pyrites (-25.23%), Fertilisers, Crude & Manufactured (-18.15%), Project Goods (-17.92%), Vegetable Oil (-16.56%), Newsprint (-10.78%), Pulp And Waste Paper (-5.63%), Medicinal & Pharmaceutical Products (-2.64%) and Iron & Steel (-1.43%) record negative growth during August 2024 over the corresponding month of last year.
- Services exports is estimated to grow by 10.84 percent during April-August 2024* over April-August 2023.
- Top 5 export destinations, in terms of change in value, exhibiting positive growth in August 2024 vis a vis August 2023 are Netherland (28.92%), Kenya (105.72%), Russia (44.61%), Brazil (27.05%) and U K (14.57%).
- Top 5 export destinations, in terms of change in value, exhibiting positive growth in April-August 2024 vis a vis April-August 2023 are Netherland (36.43%), U S A (5.72%), U Arab Emts (9.24%), Malaysia (40.06%) and U K (14.59%).
- Top 5 import sources, in terms of change in value, exhibiting growth in August 2024 vis a vis August 2023 are U Arab Emts (72.7%), Switzerland (80.45%), China P Rp (15.55%), U K (124.55%) and Oman (274.95%).
- Top 5 import sources, in terms of change in value, exhibiting growth in April-August 2024 vis a vis April-August 2023 are U Arab Emts (52.6%), China P Rp (10.96%), Russia (6.39%), Switzerland (16.88%) and Taiwan (40.38%).
Link for Quick Estimates
Trade balance shows widening deficit as imports outpace exports, driven by stronger import growth and mixed export performance. Estimated trade aggregates for April-August 2024 show total exports of USD 328.86 billion and total imports of USD 375.33 billion, producing a widened trade deficit versus the prior year driven by stronger import growth. Services exports registered notable estimated growth, generating a services surplus that partially offsets the larger merchandise deficit. Sectoral contributors to export growth include Engineering Goods, Chemicals, Electronic Goods, Textiles and Pharmaceuticals, while non petroleum and non gems imports rose more sharply, affecting trade composition.

