Login
 Generate professional replies, appeals, opinions to Show Cause Notices, assessment orders, audit objections, and other legal communications using TaxTMI's AI Drafter.
Just a moment...
Generate professional replies, appeals, opinions to Show Cause Notices, assessment orders, audit objections, and other legal communications using TaxTMI's AI Drafter.
Press 'Enter' to add multiple search terms. Rules for Better Search
Press 'Enter' after typing page number.
Press 'Enter' after typing page number.
No Folders have been created
Are you sure you want to delete "My most important" ?
NOTE:
Press 'Enter' after typing page number.
Press 'Enter' after typing page number.
All News
Press 'Enter' after typing page number.
Press 'Enter' after typing page number.
All News
Note
Bookmark
Share
Don't have an account? Register Here
Average monthly gross collection for FY2023-24 is ₹1.67 lakh crore, exceeding ₹1.5 lakh for FY2022-23
Gross GST collection reaches ₹18.40 lakh crore for FY2023-24, grows 11.7% Y-o-Y
Net revenue at ₹1.51 lakh crore is up 13.6% for the month and up by 13% for the year at ₹16.36 lakh crore
Gross Goods and Services Tax (GST) revenue collected for February 2024 is ₹1,68,337 crore, marking a robust 12.5% increase compared to that in the same month in 2023. This growth was driven by a 13.9% rise in GST from domestic transactions and 8.5% increase in GST from import of goods. GST revenue net of refunds for February 2024 is ₹1.51 lakh crore which is a growth of 13.6% over that for the same period last year.
Strong Consistent Performance in FY 2023-24: As of February 2024, the total gross GST collection for the current fiscal year stands at ₹18.40 lakh crore, which is 11.7% higher than the collection for the same period in FY 2022-23. The average monthly gross collection for FY 2023-24 is ₹1.67 lakh crore, exceeding the ₹1.5 lakh crore collected in the previous year's corresponding period. GST revenue net of refunds as of February 2024 for the current fiscal year is ₹16.36 lakh crore which is a growth of 13.0% over that for the same period last year. Overall, the GST revenue figures demonstrate continued growth momentum and positive performance.
Breakdown of February 2024 Collections:
Inter-Governmental Settlement: The central government settled ₹41,856 crore to CGST and ₹35,953 crore to SGST from the IGST collected. This translates to a total revenue of ₹73,641 crore for CGST and ₹75,569 crore for SGST after regular settlement.
The chart below shows trends in monthly gross GST revenues during the current year. Table-1 shows the state-wise figures of GST collected in each State during the month of February, 2024 as compared to February, 2023. Table-2 shows the state-wise figures of post settlement GST revenue of each State till the month of February, 2024.
Chart: Trends in GST Collection
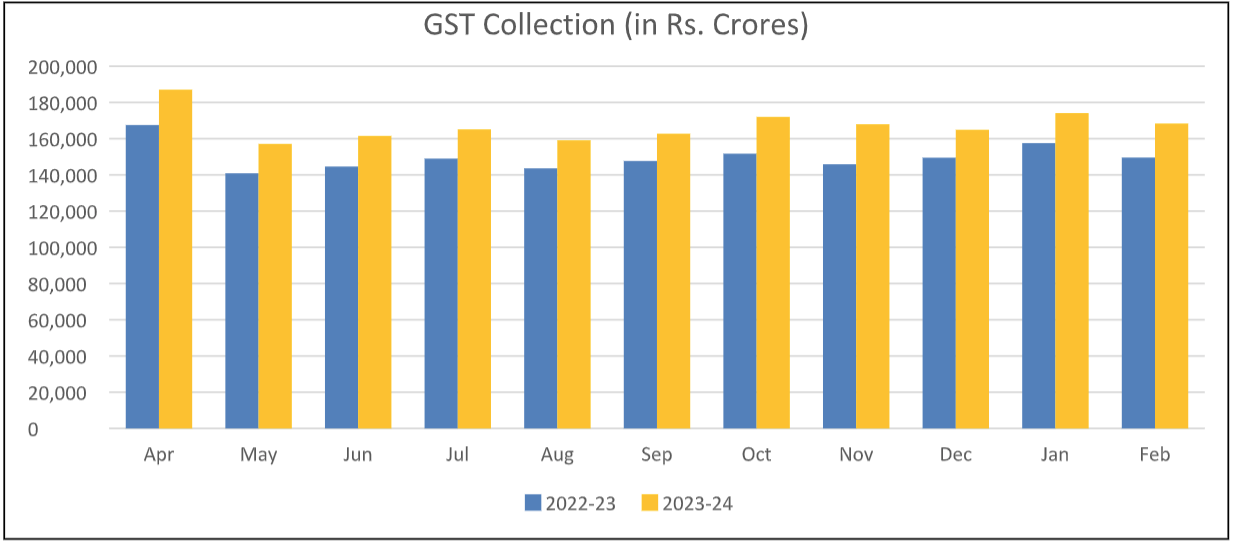
Table 1: State-wise growth of GST Revenues during February, 2024
State/UT | Feb-23 | Feb-24 | Growth (%) |
Jammu and Kashmir | 434 | 532 | 23% |
Himachal Pradesh | 691 | 746 | 8% |
Punjab | 1,651 | 1,955 | 18% |
Chandigarh | 188 | 211 | 12% |
Uttarakhand | 1,405 | 1,525 | 9% |
Haryana | 7,310 | 8,269 | 13% |
Delhi | 4,769 | 5,544 | 16% |
Rajasthan | 3,941 | 4,211 | 7% |
Uttar Pradesh | 7,431 | 8,054 | 8% |
Bihar | 1,499 | 1,491 | -1% |
Sikkim | 265 | 299 | 13% |
Arunachal Pradesh | 78 | 101 | 29% |
Nagaland | 54 | 51 | -5% |
Manipur | 64 | 56 | -13% |
Mizoram | 58 | 49 | -14% |
Tripura | 79 | 85 | 8% |
Meghalaya | 189 | 193 | 2% |
Assam | 1,111 | 1,390 | 25% |
West Bengal | 4,955 | 5,357 | 8% |
Jharkhand | 2,962 | 2,933 | -1% |
Odisha | 4,519 | 5,136 | 14% |
Chhattisgarh | 3,009 | 3,124 | 4% |
Madhya Pradesh | 3,235 | 3,572 | 10% |
Gujarat | 9,574 | 11,029 | 15% |
Dadra and Nagar Haveli and Daman & Diu | 283 | 355 | 25% |
Maharashtra | 22,349 | 27,065 | 21% |
Karnataka | 10,809 | 12,815 | 19% |
Goa | 493 | 581 | 18% |
Lakshadweep | 3 | 2 | -36% |
Kerala | 2,326 | 2,688 | 16% |
Tamil Nadu | 8,774 | 9,713 | 11% |
Puducherry | 188 | 231 | 23% |
Andaman and Nicobar Islands | 31 | 39 | 28% |
Telangana | 4,424 | 5,211 | 18% |
Andhra Pradesh | 3,557 | 3,678 | 3% |
Ladakh | 24 | 35 | 43% |
Other Territory | 211 | 204 | -3% |
Center Jurisdiction | 154 | 232 | 51% |
Grand Total | 1,13,096 | 1,28,760 | 14% |
Table-2: SGST & SGST portion of IGST settled to States/UTs
April-February (Rs. in crore)
| Pre-Settlement SGST | Post-Settlement SGST | ||||
State/UT | 2022-23 | 2023-24 | Growth | 2022-23 | 2023-24 | Growth |
Jammu and Kashmir | 2,133 | 2,680 | 26% | 6,672 | 7,415 | 11% |
Himachal Pradesh | 2,150 | 2,371 | 10% | 5,133 | 5,138 | 0% |
Punjab | 7,023 | 7,689 | 9% | 17,810 | 20,240 | 14% |
Chandigarh | 577 | 626 | 9% | 1,963 | 2,117 | 8% |
Uttarakhand | 4,365 | 4,934 | 13% | 6,997 | 7,708 | 10% |
Haryana | 16,547 | 18,568 | 12% | 28,469 | 31,975 | 12% |
Delhi | 12,504 | 14,235 | 14% | 26,097 | 29,187 | 12% |
Rajasthan | 14,227 | 15,762 | 11% | 32,008 | 35,505 | 11% |
Uttar Pradesh | 24,900 | 29,560 | 19% | 60,572 | 69,782 | 15% |
Bihar | 6,678 | 7,478 | 12% | 21,319 | 24,231 | 14% |
Sikkim | 274 | 387 | 42% | 773 | 877 | 13% |
Arunachal Pradesh | 422 | 548 | 30% | 1,451 | 1,721 | 19% |
Nagaland | 203 | 270 | 33% | 884 | 955 | 8% |
Manipur | 288 | 310 | 8% | 1,318 | 1,011 | -23% |
Mizoram | 189 | 245 | 29% | 798 | 879 | 10% |
Tripura | 390 | 455 | 17% | 1,348 | 1,435 | 6% |
Meghalaya | 435 | 550 | 26% | 1,370 | 1,557 | 14% |
Assam | 4,694 | 5,413 | 15% | 11,524 | 13,347 | 16% |
West Bengal | 19,626 | 21,407 | 9% | 35,884 | 38,335 | 7% |
Jharkhand | 7,034 | 7,967 | 13% | 10,359 | 11,220 | 8% |
Odisha | 12,779 | 14,796 | 16% | 17,636 | 22,636 | 28% |
Chhattisgarh | 6,765 | 7,417 | 10% | 10,320 | 12,450 | 21% |
Madhya Pradesh | 9,893 | 11,865 | 20% | 25,483 | 30,386 | 19% |
Gujarat | 34,364 | 38,465 | 12% | 52,751 | 58,317 | 11% |
Dadra and Nagar Haveli and Daman and Diu | 581 | 599 | 3% | 1,093 | 1,006 | -8% |
Maharashtra | 77,909 | 91,584 | 18% | 1,18,392 | 1,34,593 | 14% |
Karnataka | 32,302 | 37,305 | 15% | 60,218 | 68,428 | 14% |
Goa | 1,830 | 2,137 | 17% | 3,270 | 3,752 | 15% |
Lakshadweep | 9 | 18 | 107% | 37 | 79 | 114% |
Kerala | 11,247 | 12,809 | 14% | 26,851 | 28,358 | 6% |
Tamil Nadu | 32,929 | 37,024 | 12% | 53,091 | 58,904 | 11% |
Puducherry | 426 | 467 | 10% | 1,069 | 1,255 | 17% |
Andaman and Nicobar Islands | 165 | 191 | 16% | 445 | 487 | 9% |
Telangana | 15,294 | 18,175 | 19% | 34,686 | 36,949 | 7% |
Andhra Pradesh | 11,462 | 12,695 | 11% | 26,121 | 28,873 | 11% |
Ladakh | 160 | 230 | 44% | 494 | 620 | 25% |
Other Territory | 165 | 218 | 32% | 542 | 1,043 | 93% |
Grand Total | 3,72,937 | 4,27,449 | 15% | 7,05,246 | 7,92,773 | 12% |
GST revenue growth reflects stronger domestic and import tax receipts and larger post-settlement transfers to central and state accounts. Gross GST collections for February 2024 increased year-on-year with net receipts after refunds also rising; domestic GST contributed the principal share of growth while import GST expanded more modestly. The statement details component amounts for CGST, SGST, IGST (including import collections) and cess, and explains inter-governmental settlements from IGST that produced specified post-settlement CGST and SGST totals. Fiscal-year-to-date averages and state-level pre- and post-settlement tables show elevated monthly averages and distributive impacts on state revenues.
Press 'Enter' after typing page number.