Login
 Generate professional replies, appeals, opinions to Show Cause Notices, assessment orders, audit objections, and other legal communications using TaxTMI's AI Drafter.
Just a moment...
Generate professional replies, appeals, opinions to Show Cause Notices, assessment orders, audit objections, and other legal communications using TaxTMI's AI Drafter.
Press 'Enter' to add multiple search terms. Rules for Better Search
Press 'Enter' after typing page number.
Press 'Enter' after typing page number.
No Folders have been created
Are you sure you want to delete "My most important" ?
NOTE:
Press 'Enter' after typing page number.
Press 'Enter' after typing page number.
All News
Press 'Enter' after typing page number.
Press 'Enter' after typing page number.
All News
Note
Bookmark
Share
Don't have an account? Register Here
Gross GST collection averages ₹1.66 lakh crore in first 9 months of FY24
₹1,64,882 crore gross GST revenue collection for December, 2023
During the April-December 2023 period, gross GST collection witnessed a robust 12% y-o-y growth, reaching ₹14.97 lakh crore, as against ₹13.40 lakh crore collected in the same period of the previous year (April-December 2022).
The average monthly gross GST collection of ₹1.66 lakh crore in the first 9-month period this year represents a 12% increase compared to the ₹1.49 lakh crore average recorded in the corresponding period of FY23.
The gross GST revenue collected in the month of December, 2023 is ₹1,64,882 crore out of which CGST is ₹30,443 crore, SGST is ₹37,935 crore, IGST is ₹84,255 crore (including ₹41,534 crore collected on import of goods) and cess is ₹12,249 crore (including ₹1,079 crore collected on import of goods). Notably, this marks the seventh month so far this year with collections exceeding ₹1.60 lakh crore.
The government has settled ₹40,057 crore to CGST and ₹33,652 crore to SGST from IGST. The total revenue of Centre and the States in the month of December, 2023 after regular settlement is ₹70,501 crore for CGST and ₹71,587 crore for the SGST.
The revenues for the month of December, 2023 are 10.3% higher than the GST revenues in the same month last year. During the month, the revenues from domestic transactions (including import of services) are 13% higher than the revenues from these sources during the same month last year.
The chart below shows trends in monthly gross GST revenues during the current year. Table-1 shows the state-wise figures of GST collected in each State during the month of December 2023 as compared to December 2022. Table-2 shows the state-wise figures of post settlement GST revenue of each State till the month of December 2023.
Chart: Trends in GST Collection
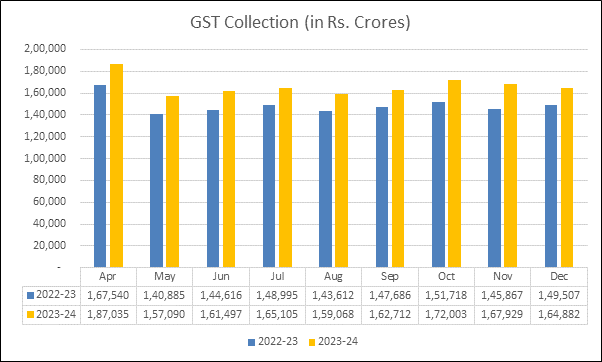
Table -1: State-wise growth of GST Revenues during December, 2023
State/UT | Dec-22 | Dec-23 | Growth (%) |
Jammu and Kashmir | 410 | 492 | 20% |
Himachal Pradesh | 708 | 745 | 5% |
Punjab | 1,734 | 1,875 | 8% |
Chandigarh | 218 | 281 | 29% |
Uttarakhand | 1,253 | 1,470 | 17% |
Haryana | 6,678 | 8,130 | 22% |
Delhi | 4,401 | 5,121 | 16% |
Rajasthan | 3,789 | 3,828 | 1% |
Uttar Pradesh | 7,178 | 8,011 | 12% |
Bihar | 1,309 | 1,487 | 14% |
Sikkim | 290 | 254 | -13% |
Arunachal Pradesh | 67 | 97 | 44% |
Nagaland | 44 | 46 | 4% |
Manipur | 46 | 50 | 9% |
Mizoram | 23 | 27 | 18% |
Tripura | 78 | 79 | 2% |
Meghalaya | 171 | 171 | 0% |
Assam | 1,150 | 1,303 | 13% |
West Bengal | 4,583 | 5,019 | 10% |
Jharkhand | 2,536 | 2,632 | 4% |
Odisha | 3,854 | 4,351 | 13% |
Chhattisgarh | 2,585 | 2,613 | 1% |
Madhya Pradesh | 3,079 | 3,423 | 11% |
Gujarat | 9,238 | 9,874 | 7% |
Dadra and Nagar Haveli and Daman & Diu | 318 | 333 | 5% |
Maharashtra | 23,598 | 26,814 | 14% |
Karnataka | 10,061 | 11,759 | 17% |
Goa | 460 | 553 | 20% |
Lakshadweep | 1 | 4 | 310% |
Kerala | 2,185 | 2,458 | 12% |
Tamil Nadu | 8,324 | 9,888 | 19% |
Puducherry | 192 | 232 | 21% |
Andaman and Nicobar Islands | 21 | 28 | 35% |
Telangana | 4,178 | 4,753 | 14% |
Andhra Pradesh | 3,182 | 3,545 | 11% |
Ladakh | 26 | 58 | 127% |
Other Territory | 249 | 227 | -9% |
Center Jurisdiction | 179 | 243 | 36% |
Grand Total | 1,08,394 | 1,22,270 | 13% |
Table-2: SGST & SGST portion of IGST settled to States/UTs
April-December (Rs. in crore)
| Pre-Settlement SGST | Post-Settlement SGST[2] | ||||
State/UT | 2022-23 | 2023-24 | Growth | 2022-23 | 2023-24 | Growth |
Jammu and Kashmir | 1,699 | 2,188 | 29% | 5,442 | 6,021 | 11% |
Himachal Pradesh | 1,731 | 1,929 | 11% | 4,205 | 4,160 | -1% |
Punjab | 5,719 | 6,280 | 10% | 14,371 | 16,382 | 14% |
Chandigarh | 451 | 495 | 10% | 1,582 | 1,708 | 8% |
Uttarakhand | 3,568 | 4,046 | 13% | 5,758 | 6,288 | 9% |
Haryana | 13,424 | 14,992 | 12% | 23,134 | 25,733 | 11% |
Delhi | 10,167 | 11,544 | 14% | 21,426 | 23,611 | 10% |
Rajasthan | 11,483 | 12,732 | 11% | 25,903 | 28,794 | 11% |
Uttar Pradesh | 20,098 | 24,164 | 20% | 49,384 | 55,656 | 13% |
Bihar | 5,307 | 6,067 | 14% | 17,360 | 19,157 | 10% |
Sikkim | 221 | 341 | 54% | 623 | 738 | 18% |
Arunachal Pradesh | 344 | 464 | 35% | 1,176 | 1,418 | 21% |
Nagaland | 158 | 226 | 43% | 716 | 781 | 9% |
Manipur | 216 | 254 | 18% | 1,046 | 813 | -22% |
Mizoram | 130 | 197 | 51% | 623 | 707 | 14% |
Tripura | 311 | 375 | 21% | 1,074 | 1,166 | 9% |
Meghalaya | 339 | 438 | 29% | 1,087 | 1,244 | 14% |
Assam | 3,785 | 4,346 | 15% | 9,280 | 10,727 | 16% |
West Bengal | 15,959 | 17,428 | 9% | 29,170 | 31,300 | 7% |
Jharkhand | 5,562 | 6,545 | 18% | 8,237 | 9,148 | 11% |
Odisha | 10,313 | 11,903 | 15% | 14,046 | 18,093 | 29% |
Chhattisgarh | 5,426 | 6,004 | 11% | 8,370 | 9,937 | 19% |
Madhya Pradesh | 7,890 | 9,606 | 22% | 20,834 | 24,026 | 15% |
Gujarat | 27,820 | 31,028 | 12% | 42,354 | 46,624 | 10% |
Dadra and Nagar Haveli and Daman and Diu | 479 | 481 | 0% | 889 | 804 | -10% |
Maharashtra | 63,169 | 74,589 | 18% | 95,981 | 1,08,887 | 13% |
Karnataka | 25,976 | 30,070 | 16% | 48,642 | 54,881 | 13% |
Goa | 1,435 | 1,685 | 17% | 2,606 | 2,951 | 13% |
Lakshadweep | 7 | 17 | 153% | 22 | 72 | 222% |
Kerala | 9,011 | 10,293 | 14% | 21,953 | 23,045 | 5% |
Tamil Nadu | 26,657 | 30,329 | 14% | 43,332 | 47,960 | 11% |
Puducherry | 344 | 371 | 8% | 876 | 1,037 | 18% |
Andaman and Nicobar Islands | 133 | 155 | 16% | 365 | 388 | 7% |
Telangana | 12,287 | 14,579 | 19% | 27,964 | 29,889 | 7% |
Andhra Pradesh | 9,298 | 10,407 | 12% | 21,137 | 23,481 | 11% |
Ladakh | 123 | 186 | 51% | 420 | 523 | 25% |
Other Territory | 135 | 182 | 35% | 420 | 903 | 115% |
Grand Total | 3,01,175 | 3,46,938 | 15% | 5,71,807 | 6,39,052 | 12% |
GST revenue growth continues as monthly collections and IGST settlements bolster central and state receipts. Gross GST collections rose 12% year on year in April-December 2023 with a higher average monthly gross collection than the prior year. December 2023 receipts are broken down into CGST, SGST, IGST (including imports) and cess, and December marked the seventh month with collections above the monthly high threshold. The release reports IGST transfers to CGST and SGST, post settlement Centre and State totals for December, and provides state wise pre and post settlement SGST figures for April-December to show distributional growth and the role of import and domestic transaction revenues.
Press 'Enter' after typing page number.