Merchandise Exports in October 2023 registered 6.21 percent growth at USD 33.57 over USD 31.60 Billion in October 2022.
The estimated services export for April-October 2023 is USD 192.65 Billion as compared to USD 181.37 Billion in April-October 2022, projecting to grow by 6.22 percent.
Overall Trade Deficit during April-October reduces by 35.86 percent from USD 89.86 Billion in 2022 to USD 57.64 Billion in 2023; Merchandise Trade deficit also improves from USD 167.14 Billion in April-October 2022 to USD 147.07 in April-October 2023.
Non-petroleum and non-Gems & Jewellery exports register an increase by 11.74 percent from USD 21.99 Billion in October 2022 to USD 24.57 Billion in October 2023.
Major contributors to export growth in October 2023 include Drugs & Pharmaceuticals, Engineering Goods, Electronic Goods, Cotton Yarn/Fabs./made-ups, Handloom Products etc., Iron Ore, Ceramic products & glassware and Meat, dairy & poultry products.
Drugs and pharma exports grew by 29.31 percent in October 2023 at USD 2.42 Billion from USD 1.87 Billion in October 2022.
Engineering Goods exports record a growth of 7.2 percent from USD 7.55 Billion in October 2022 to USD 8.09 Billion in October 2023.
Electronic Goods exports register a growth of 28.23 percent at USD 2.38 Billion during October 2023 as compared to USD 1.85 Billion in October 2022.
Agricultural exports continue to grow in October 2023: Cereal preparations & miscellaneous processed items (40.95%), Oil seeds (29.7%), Fruits & Vegetables (24.48%), Oil Meals (17.32%), Spices (10.78%), Coffee (8.45%), Tea (4.12%), Cashew (3.29%).
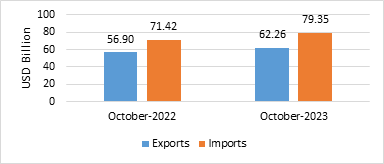
- India’s overall exports (Merchandise and Services combined) in October 2023* is estimated to be USD 62.26 Billion, exhibiting a positive growth of 9.43 per cent over October 2022. Overall imports in October 2023* is estimated to be USD 79.35 Billion, exhibiting a positive growth of 11.10 per cent over October 2022.
Table 1: Trade during October 2023*
| | October 2023 (USD Billion) | October 2022 (USD Billion) |
Merchandise | Exports | 33.57 | 31.60 |
Imports | 65.03 | 57.91 |
Services* | Exports | 28.70 | 25.30 |
Imports | 14.32 | 13.51 |
Overall Trade (Merchandise +Services) * | Exports | 62.26 | 56.90 |
Imports | 79.35 | 71.42 |
Trade Balance | -17.08 | -14.52 |
* Note: The latest data for services sector released by RBI is for September 2023. The data for October 2023 is an estimation, which will be revised based on RBI’s subsequent release. (ii) Data for April-October 2022 and April-June 2023 has been revised on pro-rata basis using quarterly balance of payments data.
Fig 1: Overall Trade during October 2023*
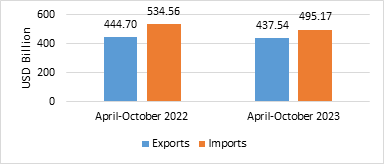
- India’s overall exports (Merchandise and Services combined) in April-October 2023* are estimated to be USD 437.54 Billion, exhibiting a negative growth of (-) 1.61 per cent over April-October 2022. Overall imports in April-October 2023* are estimated to be USD 495.17 Billion, exhibiting a negative growth of (-) 7.37 per cent over April-October 2022.
Table 2: Trade during April-October 2023*
| | April-October 2023 (USD Billion) | April-October 2022 (USD Billion) |
Merchandise | Exports | 244.89 | 263.33 |
Imports | 391.96 | 430.47 |
Services* | Exports | 192.65 | 181.37 |
Imports | 103.22 | 104.09 |
Overall Trade (Merchandise+ Services)* | Exports | 437.54 | 444.70 |
Imports | 495.17 | 534.56 |
Trade Balance | -57.64 | -89.86 |
Fig 2: Overall Trade during April-October 2023*
MERCHANDISE TRADE
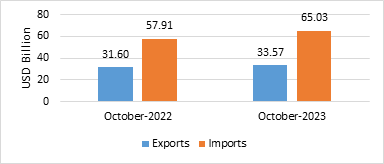
- Merchandise exports in October 2023 were USD 33.57 Billion, as compared to USD 31.60 Billion in October 2022.
- Merchandise imports in October 2023 were USD 65.03 Billion, as compared to USD 57.91 Billion in October 2022.
Fig 3: Merchandise Trade during October 2023
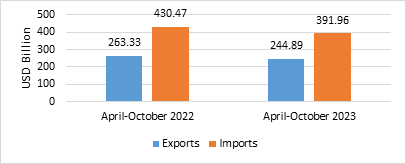
- Merchandise exports for the period April-October 2023 were USD 244.89 Billion as against USD 263.33 Billion during April-October 2022.
- Merchandise imports for the period April-October 2023 were USD 391.96 Billion as against USD 430.47 Billion during April-October 2022.
- The merchandise trade deficit for April-October 2023 was estimated at USD 147.07 Billion as against USD 167.14 Billion during April-October 2022.
Fig 4: Merchandise Trade during April-October 2023
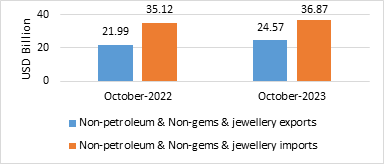
- Non-petroleum and non-gems & jewellery exports in October 2023 were USD 24.57 Billion, compared to USD 21.99 Billion in October 2022.
- Non-petroleum, non-gems & jewellery (gold, silver & precious metals) imports in October 2023 were USD 36.87 Billion, compared to USD 35.12 Billion in October 2022.
Table 3: Trade excluding Petroleum and Gems & Jewellery during October 2023
| October 2023 (USD Billion) | October 2022 (USD Billion) |
Non- petroleum exports | 27.56 | 25.30 |
Non- petroleum imports | 47.36 | 41.57 |
Non-petroleum & Non Gems & Jewellery exports | 24.57 | 21.99 |
Non-petroleum & Non Gems & Jewellery imports | 36.87 | 35.12 |
Note: Gems & Jewellery Imports include Gold, Silver & Pearls, precious & Semi-precious stones
Fig 5: Trade excluding Petroleum and Gems & Jewellery during October 2023
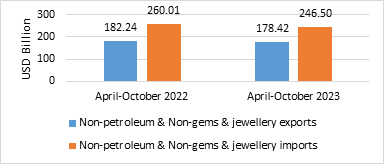
- Non-petroleum and non-gems & jewellery exports during April-October 2023 was USD 178.42 Billion, as compared to USD 182.24 Billion in April-October 2022.
- Non-petroleum, non-gems & jewellery (gold, silver & precious metals) imports were USD 246.50 Billion in April-October 2023 as compared to USD 260.01 Billion in April-October 2022.
Table 4: Trade excluding Petroleum and Gems & Jewellery during April-October 2023
| April-October 2023 (USD Billion) | April-October 2022 (USD Billion) |
Non- petroleum exports | 197.02 | 206.19 |
Non- petroleum imports | 292.01 | 307.50 |
Non-petroleum & Non Gems & Jewellery exports | 178.42 | 182.24 |
Non-petroleum & Non Gems & Jewellery imports | 246.50 | 260.01 |
Note: Gems & Jewellery Imports include Gold, Silver & Pearls, precious & Semi-precious stones
Fig 6: Trade excluding Petroleum and Gems & Jewellery during April-October 2023
SERVICES TRADE
- The estimated value of services export for October 2023* is USD 28.70 Billion, as compared to USD 25.30 Billion in October 2022.
- The estimated value of services import for October 2023* is USD 14.32 Billion as compared to USD 13.51 Billion in October 2022.
Fig 7: Services Trade during October 2023*

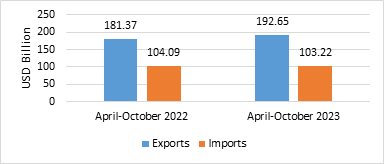
- The estimated value of services export for April-October 2023* is USD 192.65 Billion as compared to USD 181.37 Billion in April-October 2022.
- The estimated value of services imports for April-October 2023* is USD 103.22 Billion as compared to USD 104.09 Billion in April-October 2022.
- The services trade surplus for April-October 2023* is estimated at USD 89.43 Billion as against USD 77.28 Billion in April-October 2022.
Fig 8: Services Trade during April-October 2023*
- For the month of October 2023, under merchandise exports, 22 of the 30 key sectors exhibited positive growth in October 2023 as compared to same period last year (October 2022). These include Iron Ore (2595.91%), Ceramic Products & Glassware (48.16%), Tobacco (47.6%), Cereal Preparations & Miscellaneous Processed Items (40.95%), Meat, Dairy & Poultry Products (38.57%), Cotton Yarn/Fabs./Made-Ups, Handloom Products Etc. (36.49%), Oil Seeds (29.7%), Drugs & Pharmaceuticals (29.31%), Electronic Goods (28.23%), Fruits & Vegetables (24.48%), Oil Meals (17.32%), Carpet (16.63%), Plastic & Linoleum (12.83%), Spices (10.78%), Man-Made Yarn/Fabs./Made-Ups Etc. (10.23%), Coffee (8.45%), Marine Products (8.16%), Engineering Goods (7.2%), Handicrafts Excl. Hand Made Carpet (4.72%), Tea (4.12%), Cashew (3.29%) and Jute Mfg. Including Floor Covering (0.42%).
- Under merchandise imports, 10 out of 30 key sectors exhibited negative growth in October 2023. These include Cotton Raw & Waste (-78.69%), Vegetable Oil (-35.7%), Fertilisers, Crude & Manufactured (-34.58%), Transport Equipment (-33.99%), Pulp and Waste Paper (-33.38%), Newsprint (-33.08%), Project Goods (-23.73%), Pearls, Precious & Semi-Precious Stones (-9.76%), Wood & Wood Products (-7.82%) and Leather & Leather Products (-5.38%).
- For April-October 2023, under merchandise exports, 14 of the 30 key sectors exhibited positive growth during April-October 2023 as compared to April-October 2022. These include Iron Ore (157.03%), Oil Meals (37.71%), Electronic Goods (27.7%), Oil Seeds (24.39%), Ceramic Products & Glassware (23.65%), Tobacco (12.99%), Fruits & Vegetables (12.82%), Drugs & Pharmaceuticals (8.14%), Cereal Preparations & Miscellaneous Processed Items (6.32%), Cotton Yarn/Fabs./Made-Ups, Handloom Products Etc. (5.65%), Meat, Dairy & Poultry Products (4.54%), Coffee (4.02%), Spices (2.35%) and Cashew (0.72%). During April-October 2023 electronic goods exports were recorded at USD 15.48 Billion as compared to USD 12.13 Billion during April-October 2022, registering a growth of 27.70 percent.
- Under merchandise imports, 17 of the 30 key sectors exhibited negative growth in April-October 2023 as compared to April-October 2022. These include Cotton Raw & Waste (-65.07%), Silver (-62.55%), Sulphur & Unroasted Iron Pyrites (-40.4%), Fertilisers, Crude & Manufactured (-35.92%), Coal, Coke & Briquettes, Etc. (-32.83%), Vegetable Oil (-24.87%), Pearls, Precious & Semi-Precious Stones (-24.02%), Organic & Inorganic Chemicals (-22.08%), Petroleum, Crude & Products (-18.72%), Textile Yarn Fabric, Made-Up Articles (-16.61%), Leather & Leather Products (-13.95%), Transport Equipment (-13.06%), Wood & Wood Products (-12.3%), Newsprint (-8.31%), Pulp And Waste Paper (-5.81%), Metaliferrous Ores & Other Minerals (-4.49%) and Artificial Resins, Plastic Materials, Etc. (-4.4%).
- Services exports is projected to grow positively at 6.22 percent during April-October 2023 over April-October 2022.
- India’s trade deficit has shown considerable decline in April-October 2023. Overall trade deficit for April-October 2023* is estimated at USD 57.64 Billion as compared to the deficit of USD 89.86 Billion during April-October 2022, registering a decline of (-) 35.86 percent. The merchandise trade deficit during April-October 2023 is USD 147.07 Billion compared to USD 167.14 Billion during April-October 2022, registering a decline of (-) 12.01 percent.
*Link for Quick Estimates
Trade deficit reduction signals improved external balance as exports outpaced imports growth in October and April-October. October 2023 estimates show combined merchandise and services exports rose year-on-year while imports also increased; for April-October 2023 overall exports slightly declined and imports contracted more sharply, producing a significant reduction in the overall trade deficit and an improved merchandise trade deficit. Sectoral performance showed 22 of 30 merchandise sectors with positive export growth in October, led by Drugs & Pharmaceuticals, Electronic Goods and Engineering Goods, while several import categories recorded negative growth. Services trade for October is estimated and April-October services exports expanded, increasing the services trade surplus.

