 TaxTMI
 Login
 TaxTMI
Login
Loading...
Press 'Enter' to add multiple search terms. Rules for Better Search

Press 'Enter' after typing page number.
Press 'Enter' after typing page number.


No Folders have been created
Are you sure you want to delete "My most important" ?
NOTE:
Press 'Enter' after typing page number.
Press 'Enter' after typing page number.

All News
Press 'Enter' after typing page number.
All News

Note

Bookmark

Share


The gross GST revenue collected in the month of September, 2023 is ₹1,62,712 crore out of which CGST is ₹29,818 crore, SGST is ₹37,657 crore, IGST is ₹83,623 crore (including ₹41,145 crore collected on import of goods) and cess is ₹11,613 crore (including ₹881 crore collected on import of goods).
The government has settled ₹33,736 crore to CGST and ₹27,578 crore to SGST from IGST. The total revenue of Centre and the States in the month of September, 2023 after regular settlement is ₹63,555 crore for CGST and ₹65,235 crore for the SGST.
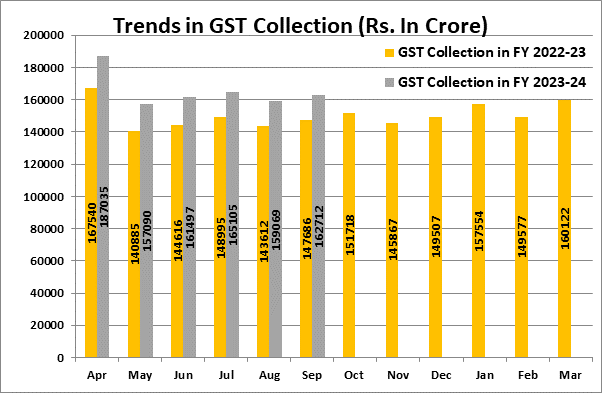
The revenues for the month of September, 2023 are 10% higher than the GST revenues in the same month last year. During the month, the revenues from domestic transactions (including import of services) are 14% higher than the revenues from these sources during the same month last year. It is for the fourth time that the gross GST collection has crossed ₹1.60 lakh crore mark in FY 2023-24.
The gross GST collection for the first half of the FY 2023-24 ending September, 2023 [₹9,92,508 crore] is 11% higher than the gross GST collection in the first half of FY 2022-23 [₹8,93,334 crore]. The average monthly gross collection in FY 2023-24 is ₹1.65 lakh crore, which is 11% higher than average monthly gross collection for first half of FY 2022-23 where it was ₹1.49 lakh crore.
The chart below shows trends in monthly gross GST revenues during the current year. Table-1 shows the state-wise figures of GST collected in each State during the month of September 2023 as compared to September 2022. Table-2 shows the state-wise figures of post settlement GST revenue of each State till the month of September 2023.
Chart: Trends in GST Collection
State-wise growth of GST Revenues during September, 2023[1]
| State/UT | Sep-22 | Sep-23 | Growth (%) |
| Jammu and Kashmir | 428 | 563 | 32% |
| Himachal Pradesh | 712 | 784 | 10% |
| Punjab | 1,710 | 1,866 | 9% |
| Chandigarh | 206 | 219 | 6% |
| Uttarakhand | 1,300 | 1,392 | 7% |
| Haryana | 7,403 | 8,009 | 8% |
| Delhi | 4,741 | 4,849 | 2% |
| Rajasthan | 3,307 | 3,869 | 17% |
| Uttar Pradesh | 7,004 | 7,844 | 12% |
| Bihar | 1,466 | 1,397 | -5% |
| Sikkim | 285 | 315 | 11% |
| Arunachal Pradesh | 64 | 81 | 27% |
| Nagaland | 49 | 52 | 5% |
| Manipur | 38 | 56 | 47% |
| Mizoram | 24 | 27 | 14% |
| Tripura | 65 | 73 | 13% |
| Meghalaya | 161 | 165 | 2% |
| Assam | 1,157 | 1,175 | 2% |
| West Bengal | 4,804 | 4,940 | 3% |
| Jharkhand | 2,463 | 2,623 | 7% |
| Odisha | 3,765 | 4,249 | 13% |
| Chhattisgarh | 2,269 | 2,684 | 18% |
| Madhya Pradesh | 2,711 | 3,118 | 15% |
| Gujarat | 9,020 | 10,129 | 12% |
| Dadra and Nagar Haveli and Daman & Diu | 312 | 350 | 12% |
| Maharashtra | 21,403 | 25,137 | 17% |
| Karnataka | 9,760 | 11,693 | 20% |
| Goa | 429 | 497 | 16% |
| Lakshadweep | 3 | 2 | -45% |
| Kerala | 2,246 | 2,505 | 12% |
| Tamil Nadu | 8,637 | 10,481 | 21% |
| Puducherry | 188 | 197 | 5% |
| Andaman and Nicobar Islands | 33 | 23 | -30% |
| Telangana | 3,915 | 5,226 | 33% |
| Andhra Pradesh | 3,132 | 3,658 | 17% |
| Ladakh | 19 | 35 | 81% |
| Other Territory | 202 | 207 | 2% |
| Center Jurisdiction | 182 | 196 | 8% |
Table-2: SGST & SGST portion of IGST settled to States/UTs
April-September (Rs. in crore)
|
| Pre-Settlement SGST | Post-Settlement SGST[2] | ||||
| State/UT | 2022-23 | 2023-24 | Growth | 2022-23 | 2023-24 | Growth |
| Jammu and Kashmir | 1,138 | 1,515 | 33% | 3,546 | 4,102 | 16% |
| Himachal Pradesh | 1,150 | 1,314 | 14% | 2,770 | 2,778 | 0% |
| Punjab | 3,846 | 4,216 | 10% | 9,215 | 10,869 | 18% |
| Chandigarh | 300 | 335 | 12% | 1,002 | 1,147 | 15% |
| Uttarakhand | 2,401 | 2,589 | 8% | 3,708 | 4,055 | 9% |
| Haryana | 9,045 | 9,864 | 9% | 14,948 | 17,161 | 15% |
| Delhi | 6,872 | 7,639 | 11% | 13,746 | 15,660 | 14% |
| Rajasthan | 7,597 | 8,488 | 12% | 16,461 | 19,129 | 16% |
| Uttar Pradesh | 13,711 | 16,069 | 17% | 32,540 | 36,109 | 11% |
| Bihar | 3,567 | 4,092 | 15% | 11,497 | 12,679 | 10% |
| Sikkim | 153 | 267 | 75% | 406 | 545 | 34% |
| Arunachal Pradesh | 253 | 343 | 35% | 807 | 1,013 | 26% |
| Nagaland | 108 | 155 | 43% | 474 | 539 | 14% |
| Manipur | 143 | 177 | 24% | 681 | 566 | -17% |
| Mizoram | 93 | 147 | 58% | 419 | 491 | 17% |
| Tripura | 206 | 258 | 25% | 696 | 790 | 13% |
| Meghalaya | 227 | 311 | 37% | 711 | 860 | 21% |
| Assam | 2,562 | 2,906 | 13% | 5,965 | 7,181 | 20% |
| West Bengal | 10,751 | 11,960 | 11% | 18,786 | 20,949 | 12% |
| Jharkhand | 3,661 | 4,462 | 22% | 5,352 | 6,043 | 13% |
| Odisha | 7,206 | 8,068 | 12% | 9,096 | 10,869 | 19% |
| Chhattisgarh | 3,720 | 4,136 | 11% | 5,292 | 6,454 | 22% |
| Madhya Pradesh | 5,221 | 6,324 | 21% | 12,768 | 15,350 | 20% |
| Gujarat | 18,628 | 20,839 | 12% | 27,226 | 31,106 | 14% |
| Dadra and Nagar Haveli and Daman and Diu | 330 | 315 | -5% | 566 | 508 | -10% |
| Maharashtra | 42,043 | 50,062 | 19% | 62,010 | 72,741 | 17% |
| Karnataka | 17,196 | 20,097 | 17% | 31,076 | 36,162 | 16% |
| Goa | 957 | 1,109 | 16% | 1,678 | 1,940 | 16% |
| Lakshadweep | 5 | 14 | 192% | 16 | 60 | 283% |
| Kerala | 6,014 | 6,986 | 16% | 14,594 | 15,827 | 8% |
| Tamil Nadu | 17,712 | 20,158 | 14% | 28,345 | 31,778 | 12% |
| Puducherry | 233 | 246 | 6% | 580 | 727 | 25% |
| Andaman and Nicobar Islands | 101 | 111 | 10% | 247 | 271 | 10% |
| Telangana | 8,184 | 9,790 | 20% | 17,685 | 20,023 | 13% |
| Andhra Pradesh | 6,298 | 7,028 | 12% | 13,496 | 15,390 | 14% |
| Ladakh | 63 | 98 | 55% | 245 | 300 | 23% |
| Other Territory | 78 | 118 | 52% | 241 | 542 | 125% |
| Grand Total | 2,01,771 | 2,32,606 | 15% | 3,68,888 | 4,22,713 | 15% |
[1]Does not include GST on import of goods
[2] Post-Settlement GST is cumulative of the GST revenues of the States/UTs and the SGST portion of the IGST settled to the States/UTs

