India’s overall exports projected to scale new heights, growing at 13.84 percent during FY 2022-23 over FY 2021-22 to achieve USD 770.18 billion worth of exports.
Merchandise exports have registered highest ever annual exports of USD 447.46 billion with 6.03% growth during FY 2022-23 surpassing the previous year (FY 2021-22) record exports of USD 422.00 billion.
Services export lead the overall exports growth and projected to set a new record annual value of USD 322.72 billion with growth rate at 26.79 percent during FY 2022-23 over FY 2021-22.
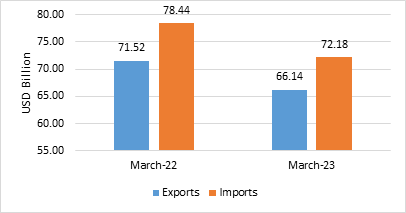
- India’s overall exports (Merchandise and Services combined) in March 2023* is estimated to be USD 66.14 Billion, exhibiting a negative growth of (-) 7.53 per cent over March 2022. Overall imports in March 2023* is estimated to be USD 72.18 Billion, exhibiting a negative growth of (-) 7.98 per cent over March 2022.
Table 1: Trade during March 2023*
| | March 2023 (USD Billion) | March 2022 (USD Billion) |
Merchandise | Exports | 38.38 | 44.57 |
Imports | 58.11 | 63.09 |
Services* | Exports | 27.75 | 26.95 |
Imports | 14.07 | 15.35 |
Overall Trade (Merchandise +Services) * | Exports | 66.14 | 71.52 |
Imports | 72.18 | 78.44 |
Trade Balance | -6.04 | -6.92 |
* Note: The latest data for services sector released by RBI is for February 2023. The data for March 2023 is an estimation, which will be revised based on RBI’s subsequent release. (ii) Data for FY 2021-22 (April-March) and April-December 2022 has been revised on pro-rata basis using quarterly balance of payments data.
Fig 1: Overall Trade during March 2023*
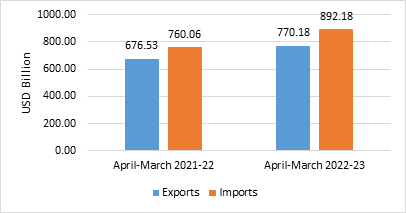
- India’s overall exports (Merchandise and Services combined) in FY 2022-23 (April-March) is estimated to exhibit a positive growth of 13.84 per cent over FY 2021-22 (April-March). As India’s domestic demand has remained steady amidst the global slump, overall imports in FY 2022-23 (April-March) is estimated to exhibit a growth of 17.38 per cent over FY 2021-22 (April-March).
Table 2: Trade during FY 2022-23 (April-March)*
| | 2022-23 (USD Billion) | 2021-22 (USD Billion) |
Merchandise | Exports | 447.46 | 422.00 |
Imports | 714.24 | 613.05 |
Services* | Exports | 322.72 | 254.53 |
Imports | 177.94 | 147.01 |
Overall Trade (Merchandise+ Services) * | Exports | 770.18 | 676.53 |
Imports | 892.18 | 760.06 |
Trade Balance | -122.00 | -83.53 |
Fig 2: Overall Trade during FY 2022-23 (April-March)*
MERCHANDISE TRADE
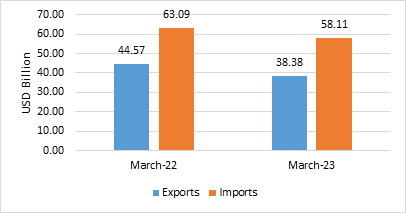
- Merchandise exports in March 2023 were USD 38.38 Billion, as compared to USD 44.57 Billion in March 2022.
- Merchandise imports in March 2023 were USD 58.11 Billion, as compared to USD 63.09 Billion in March 2022.
Fig 3: Merchandise Trade during March 2023
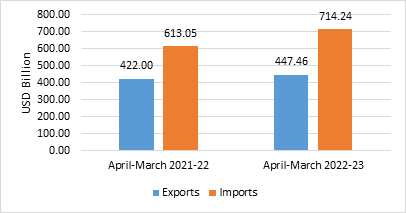
- Merchandise exports for the period FY 2022-23 (April-March) were USD 447.46 Billion as against USD 422.00 Billion during FY 2021-22 (April-March).
- Merchandise imports for the period FY 2022-23 (April-March) were USD 714.24 Billion as against USD 613.05 Billion during FY 2021-22 (April-March).
- The merchandise trade deficit for FY 2022-23 (April-March) was estimated at USD 266.78 Billion as against USD 191.05 Billion during FY 2021-22 (April-March).
Fig 4: Merchandise Trade during FY 2022-23 (April-March)
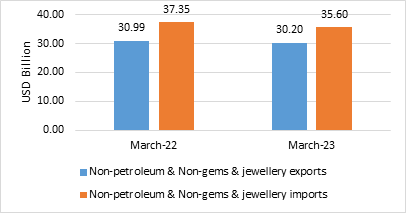
- Non-petroleum and non-gems & jewellery exports in March 2023 were USD 30.20 Billion, compared to USD 30.99 Billion in March 2022.
- Non-petroleum, non-gems & jewellery (gold, silver & precious metals) imports in March 2023 were USD 35.60 Billion, compared to USD 37.35 Billion in March 2022.
Table 3: Trade excluding Petroleum and Gems & Jewellery during March 2023
| March 2023 (USD Billion) | March 2022 (USD Billion) |
Non- petroleum exports | 32.95 | 34.77 |
Non- petroleum imports | 41.99 | 41.95 |
Non-petroleum & Non Gems & Jewellery exports | 30.20 | 30.99 |
Non-petroleum & Non Gems & Jewellery imports | 35.60 | 37.35 |
Note: Gems &Jewellery Imports include Gold, Silver & Pearls, precious & Semi-precious stones
Fig 5: Trade excluding Petroleum and Gems & Jewellery during March 2023
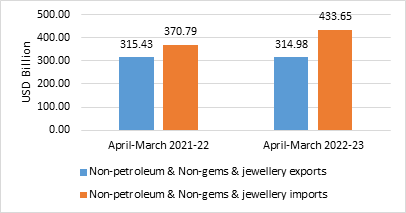
- Non-petroleum and non-gems & jewellery exports during FY 2022-23 (April-March) was USD 314.98 Billion, as compared to USD 315.43 Billion in FY 2021-22 (April-March).
- Non-petroleum, non-gems & jewellery (gold, silver & precious metals) imports were USD 433.65 Billion in FY 2022-23 (April-March) as compared to USD 370.79 Billion in FY 2021-22 (April-March).
Table 4: Trade excluding Petroleum and Gems & Jewellery during FY 2022-23 (April-March)
| 2022-23 (USD Billion) | 2021-22 (USD Billion) |
Non- petroleum exports | 352.94 | 354.53 |
Non- petroleum imports | 504.66 | 451.24 |
Non-petroleum & Non Gems & Jewellery exports | 314.98 | 315.43 |
Non-petroleum & Non Gems & Jewellery imports | 433.65 | 370.79 |
Note: Gems &Jewellery Imports include Gold, Silver & Pearls, precious & Semi-precious stones
Fig 6: Trade excluding Petroleum and Gems & Jewellery during FY 2022-23 (April-March)
SERVICES TRADE
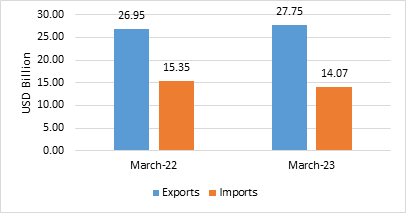
- The estimated value of services export for March 2023* is USD 27.75 Billion, as compared to USD 26.95 Billion in March 2022.
- The estimated value of services import for March 2023* is USD 14.07 Billion as compared to USD 15.35 Billion in March 2022.
Fig 7: Services Trade during March 2023*
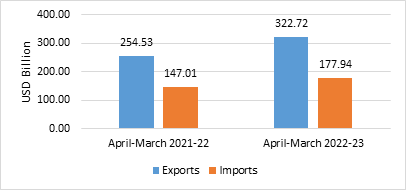
- The estimated value of services export for FY 2022-23 (April-March)* is USD 322.72 Billion as compared to USD 254.53 Billion in FY 2021-22 (April-March).
- The estimated value of services imports for FY 2022-23 (April-March)* is USD 177.94 Billion as compared to USD 147.01 Billion in FY 2021-22 (April-March).
- The services trade surplus for FY 2022-23 (April-March)*is estimated at USD 144.78 Billion as against USD 107.52 Billion in FY 2021-22 (April-March).
Fig 8: Services Trade during FY 2022-23 (April-March)*
- In spite of strong global headwinds, India’s overall exports is projected to grow at 13.84 percent during FY 2022-23 (April-March) over FY 2021-22 (April-March).
- Under merchandise exports, 13 of the 30 key sectors exhibited positive growth in March 2023 as compared to same period last year (March 2022). These include Oil Meals (156.56%), Oil Seeds (99.5%), Electronic Goods (57.36%), Coffee (17.86%), Marine Products (12.85%), Fruits & Vegetables (11.37%), Rice (10.02%), Ceramic Products & Glassware (9.73%), Iron Ore (6.85%), Drugs & Pharmaceuticals (4.19%), Meat, Dairy & Poultry Products (3.44%), Tobacco (3.04%), and Cereal Preparations & Miscellaneous Processed Items (2.7%).
- Under merchandise exports, 17 of the 30 key sectors exhibited positive growth during FY 2022-23 (April-March) as compared to FY 2021-22 (April-March). These include Oil Meals (55.13%), Electronic Goods (50.52%), Petroleum Products (40.1%), Tobacco (31.37%), Oil Seeds (20.13%), Rice (15.22%), Cereal Preparations & Miscellaneous Processed Items (14.61%), Coffee (12.29%), Fruits & Vegetables (11.19%), Other Cereals (9.74%), Tea (8.85%), Leather & Leather Products (8.47%), Ceramic Products & Glassware (7.83%), Marine Products (3.93%), Drugs & Pharmaceuticals (3.25%), Organic & Inorganic Chemicals (3.23%) and RMG of all Textiles (1.1%).
- Exports of Electronic goods increased by 57.36 percent during March 2023 at USD 2.86 Billion as compared to USD 1.82 Billion in March 2022. During FY 2022-23 (April-March) electronic goods exports were recorded at USD 23.57 Billion as compared to USD 15.66 Billion during FY 2021-22 (April-March), registering a growth of 50.52 percent.
- Effect of duty withdrawal on Iron Ore is visible on India’s exports of the item which have exhibited positive growth of 6.85 percent during March 2023 over the same month in 2022.
- Textiles, Plastic & Linoleum exports continued to decline in March 2023 because of subdued demand due to recessionary effects in major economies.
- Under merchandise imports, 14 out of 30 key sectors exhibited negative growth in March 2023. These include Sulphur & Unroasted Iron Pyrites (-74.42%), Fertilisers, Crude & Manufactured (-50.98%), Silver (-43.64%), Coal, Coke & Briquettes, Etc. (-24.93%), Petroleum, Crude & Products (-23.79%), Vegetable Oil (-18.9%), Electronic Goods (-16.84%), Pearls, Precious & Semi-Precious Stones (-11.92%), Dyeing/Tanning/Colouring Materials (-11.56%), Cotton Raw & Waste (-11.31%), Medicinal & Pharmaceutical Products (-10.91%), Leather & Leather Products (-10.56%), Organic & Inorganic Chemicals (-5.07%) and Transport Equipment (-3.22%).
- Under merchandise imports, 6 of the 30 key sectors exhibited negative growth in FY 2022-23 (April-March) as compared to FY 2021-22 (April-March). These include Sulphur & Unroasted Iron Pyrites (-28.86%), Gold (-24.15%), Pulses (-12.79%), Medicinal & Pharmaceutical Products (-10.58%), Dyeing/Tanning/Colouring Materials. (-2.39%) and Pearls, Precious & Semi-Precious Stones (-0.99%).
- Silver imports slumped by 43.64 percent from USD 0.12 Billion in March 2022 to USD 0.07 Billion in March 2023.
- Merchandise exports growth for the period FY 2022-23 (April-March) remain impressive at 6.03 percent as against FY 2021-22 (April-March).
- China's share in India's merchandise imports have declined to 13.79% in 2022-23 from 15.43% in 2021-22. Imports of electronic goods from China has seen a decline of around $2 billion in 2022-23 (Apr-Feb) compared to same period last year. Import share from China in electronic goods has also declined from 48.1% in 2021-22 (Apr-Feb) to 41.9% in 2022-23 (Apr-Feb). A significant fall in share from China seen in imports of fertilizers from 21.9% in 2021-22 (Apr-Feb) to 13.9% in 2022-23 (Apr-Feb) and this accounts for around half a billion fall in imports from China.
- Services exports remain strong and projected to grow at 26.79 percent during FY 2022-23 (April-March) over FY 2021-22 (April-March).
* Link for Quick Estimates
Exports growth led by services expands surplus while merchandise imports outpace exports, widening the overall trade deficit. Combined merchandise and services exports expanded notably, led by a strong rise in services exports that generated a larger services surplus while merchandise imports outpaced merchandise exports, widening the merchandise and overall trade deficits. Sectoral results were mixed: electronic goods and several agricultural/processed food categories recorded strong export growth, whereas textiles and certain plastics segments declined. Non petroleum and non gems & jewellery exports held broadly steady for the year but imports rose. Shifts in import sourcing reduced reliance on a principal partner, and some data remain provisional pending RBI revisions.
 Generate professional replies, appeals, opinions to Show Cause Notices, assessment orders, audit objections, and other legal communications using TaxTMI's AI Drafter.