India’s overall exports is projected to grow at 16.18 percent during April-February 2022-23 over same period last year (April-February 2021-22), with one month remaining in the current financial year.
Merchandise exports registered growth of 7.55 percent during April-February 2022-23 over the same period last year (April-February 2021-22).
Services exports remain strong and projected to grow at 30.48 percent during April-February 2022-23 over same period last year (April-February 2021-22).
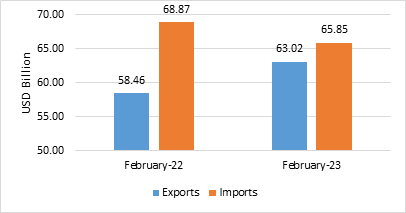
India’s overall exports (Merchandise and Services combined) in February 2023* are estimated to be USD 63.02 Billion, exhibiting a positive growth of 7.81 per cent over the same period last year. Overall imports in February 2023* are estimated to be USD 65.85 Billion, exhibiting a negative growth of (-) 4.38 per cent over the same period last year.
Table 1: Trade during February 2023*
| | February 2023 (USD Billion) | February 2022 (USD Billion) |
Merchandise | Exports | 33.88 | 37.15 |
Imports | 51.31 | 55.90 |
Services* | Exports | 29.15 | 21.30 |
Imports | 14.55 | 12.97 |
Overall Trade (Merchandise +Services) * | Exports | 63.02 | 58.46 |
Imports | 65.85 | 68.87 |
Trade Balance | -2.83 | -10.41 |
* Note: The latest data for services sector released by RBI is for January 2023. The data for February 2023 is an estimation, which will be revised based on RBI’s subsequent release. (ii) Data for April-February 2021-22 and April-September 2022 has been revised on pro-rata basis using quarterly balance of payments data.
Fig 1: Overall Trade during February 2023*
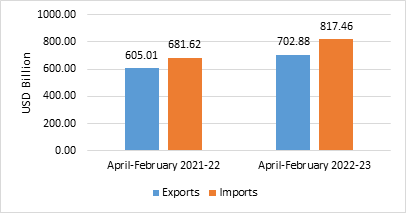
India’s overall exports (Merchandise and Services combined) in April-February 2022-23 is estimated to exhibit a positive growth of 16.18 per cent over the same period last year (April-February 2021-22). As India’s domestic demand has remained steady amidst the global slump, overall imports in April-February 2022-23 is estimated to exhibit a growth of 19.93 per cent over the same period last year.
Table 2: Trade during April-February 2022-23*
| | April-February 2022-23 (USD Billion) | April-February 2021-22 (USD Billion) |
Merchandise | Exports | 405.94 | 377.43 |
Imports | 653.47 | 549.96 |
Services* | Exports | 296.94 | 227.58 |
Imports | 164.00 | 131.66 |
Overall Trade (Merchandise+ Services) * | Exports | 702.88 | 605.01 |
Imports | 817.46 | 681.62 |
Trade Balance | -114.58 | -76.62 |
Fig 2: Overall Trade during April-February 2022-23*
MERCHANDISE TRADE
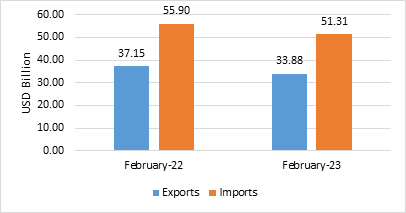
- Merchandise exports in February 2023 were USD 33.88 Billion, as compared to USD 37.15 Billion in February 2022.
- Merchandise imports in February 2023 were USD 51.31 Billion, as compared to USD 55.90 Billion in February 2022.
Fig 3: Merchandise Trade during February 2023
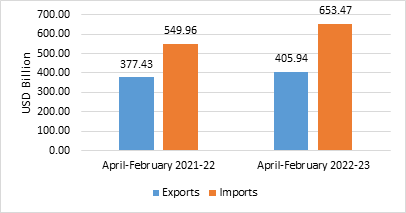
- Merchandise exports for the period April-February 2022-23 were USD 405.94 Billion as against USD 377.43 Billion during the period April-February 2021-22.
- Merchandise imports for the period April-February 2022-23 were USD 653.47 Billion as against USD 549.96 Billion during the period April-February 2021-22.
- The merchandise trade deficit for April-February 2022-23 was estimated at USD 247.52 Billion as against USD 172.53 Billion in April-February 2021-22.
Fig 4: Merchandise Trade during April-February 2022-23
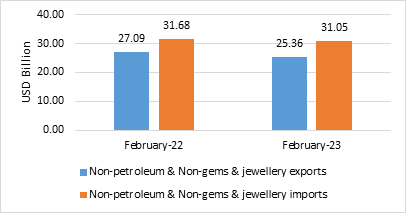
- Non-petroleum and non-gems & jewellery exports in February 2023 were USD 25.36 Billion, compared to USD 27.09 Billion in February 2022.
- Non-petroleum, non-gems & jewellery (gold, silver & precious metals) imports in February 2023 were USD 31.05 Billion, compared to USD 31.68 Billion in February 2022.
Table 3: Trade excluding Petroleum and Gems & Jewellery during February 2023
| February 2023 (USD Billion) | February 2022 (USD Billion) |
Non- petroleum exports | 28.96 | 30.26 |
Non- petroleum imports | 36.23 | 40.14 |
Non-petroleum & Non Gems & Jewellery exports | 25.36 | 27.09 |
Non-petroleum & Non Gems & Jewellery imports | 31.05 | 31.68 |
Note: Gems &Jewellery Imports include Gold, Silver & Pearls, precious & Semi-precious stones
Fig 5: Trade excluding Petroleum and Gems & Jewellery during February 2023
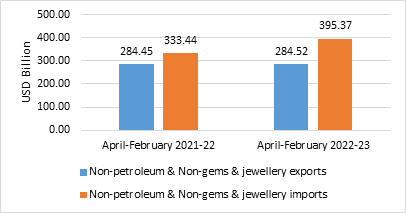
- Non-petroleum and non-gems & jewellery exports during April-February 2022-23 was USD 284.52 Billion, as compared to USD 284.45 Billion in April-February 2021-22.
- Non-petroleum, non-gems & jewellery (gold, silver & precious metals) imports were USD 395.37 Billion in April-February 2022-23 as compared to USD 333.44 Billion in April-February 2021-22.
Table 4: Trade excluding Petroleum and Gems & Jewellery during April-February 2022-23
April-February 2022-23 (USD Billion) | April-February 2021-22 (USD Billion) |
Non- petroleum exports | 319.73 | 319.77 |
Non- petroleum imports | 459.99 | 409.30 |
Non-petroleum & Non Gems & Jewellery exports | 284.52 | 284.45 |
Non-petroleum & Non Gems & Jewellery imports | 395.37 | 333.44 |
Note: Gems &Jewellery Imports include Gold, Silver & Pearls, precious & Semi-precious stones
Fig 6: Trade excluding Petroleum and Gems & Jewellery during April-February 2022-23
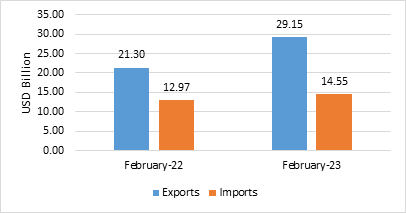
SERVICES TRADE
- The estimated value of services export for February 2023* is USD 29.15 Billion, as compared to USD 21.30 Billion in February 2022.
- The estimated value of services import for February 2023* is USD 14.55 Billion as compared to USD 12.97 Billion in February 2022
Fig 7: Services Trade during February 2023*
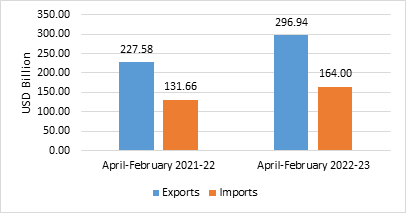
- The estimated value of services export for April-February 2022-23* is USD 296.94 Billion as compared to USD 227.58 Billion in April-February 2021-22.
- The estimated value of services imports for April-February 2022-23* is USD 164.00 Billion as compared to USD 131.66 Billion in April-February 2021-22.
- The services trade surplus for April-February 2022-23*is estimated at USD 132.95 Billion as against USD 95.92 Billion in April-February 2021-22.
Fig 8: Services Trade during April-February 2022-23*
- In spite of strong global headwinds, with one month remaining in the current financial year, India’s overall exports is projected to grow at 16.18 percent during April-February 2022-23 over same period last year (April-February 2021-22).
- Under merchandise exports, 14 of the 30 key sectors exhibited positive growth in February 2023 as compared to same period last year (February 2022). These include Oil Meals (220.96%), Iron Ore (51.37%), Spices (30.85%), Electronic Goods (29.85%), Fruits & Vegetables (17.42%), Gems & Jewellery (13.76%), Rice (11.75%), Ceramic Products & Glassware (11.5%), Other Cereals (10.65%), Oil Seeds (9.4%), Cereal Preparations & Miscellaneous Processed Items (5.22%), Marine Products (4.96%), Drugs & Pharmaceuticals (4.72%) and Mica, Coal & Other Ores, Minerals Including Processed Minerals (2.97%).
- Under merchandise exports, 17 of the 30 key sectors exhibited positive growth during April-February 2022-23 as compared to the same period last financial year (April-February 2021-22). These include Electronic Goods (49.54%), Petroleum Products (49.5%), Oil Meals (44.12%), Tobacco (34.3%), Cereal Preparations & Miscellaneous Processed Items (16.12%), Rice (15.88%), Oil Seeds (13.36%), Other Cereals (12.15%), Fruits & Vegetables (11.16%), Leather & Leather Products (11.08%), Tea (10.03%), Coffee (8.17%), Ceramic Products & Glassware (7.62%), Organic & Inorganic Chemicals (3.91%), Rmg of All Textiles (3.28%), Marine Products (3.19%) and Drugs & Pharmaceuticals (3.14%).
- Exports of Electronic goods increased by 29.85 percent during February 2023 at USD 1.93 Billion as compared to USD 1.48 Billion in February 2022. During April – February 2022-23 electronic goods exports were recorded at USD 20.70 Billion as compared to USD 13.84 Billion during the same period last year registering a growth of 49.54 percent.
- Effect of duty withdrawal on Iron Ore is visible on India’s exports of the item which have exhibited positive growth of 51.37 percent during February 2023 over the same month in 2022.
- Textiles, Plastic & Linoleum exports continued to decline in February 2023 because of subdued demand due to recessionary effects in major economies.
- Under merchandise imports, 16 out of 30 key sectors exhibited negative growth in February 2023. These include Silver (-97.31%), Fertilisers, Crude & Manufactured (-59.29%), Sulphur & Unroasted Iron Pyrites (-54.27%), Gold (-44.92%), Metaliferrous Ores & Other Minerals (-30.16%), Cotton Raw & Waste (-26.47%), Dyeing/Tanning/Colouring Materials (-23.15%), Pearls, Precious & Semi-Precious Stones (-20.86%), Leather & Leather Products (-15.38%), Textile Yarn Fabric, Made-Up Articles (-12.29%), Electronic Goods (-11.09%), Organic & Inorganic Chemicals (-5.55%), Petroleum, Crude & Products (-4.27%), Vegetable Oil (-2.48%), Pulses (-0.13%) and Non-Ferrous Metals (-0.05%).
- Under merchandise imports, 5 of the 30 key sectors exhibited negative growth in April-February 2022-23 as compared to the same period last financial year (April-February 2021-22). These include Gold (-29.71%), Sulphur & Unroasted Iron Pyrites (-25.83%), Pulses (-15.66%), Medicinal & Pharmaceutical Products (-10.54%) and Dyeing/Tanning/Colouring Materials (-1.52%).
- Gold imports, which have a bearing on the current account deficit, declined by 44.92 per cent to USD 2.63 Billion in February 2023 in comparison to USD 4.78 Billion in February 2022. Similarly, silver imports slumped by 97.31 percent from USD 0.48 Billion in February 2022 to USD 0.01 Billion in February 2023.
- Merchandise exports growth for the period April-February 2022-23 remain impressive at 7.55 percent as against the same period last financial year (April-February 2021-22).
- Services exports remain strong and projected to grow at 30.48 percent during April-February 2022-23 over same period last year (April-February 2021-22).
* Link for Quick Estimates
Exports growth projection highlights strong services performance while merchandise deficit widened, with key commodity shifts evident in estimates. India's overall exports for April-February are projected to grow, driven by robust services export expansion while merchandise exports show moderate growth; imports rose as well, widening the combined trade deficit. February estimates show services exports increasing and merchandise exports contracting year on year, with notable declines in gold and silver imports. Data for the most recent services month are provisional and subject to revision.