Login
 Generate professional replies, appeals, opinions to Show Cause Notices, assessment orders, audit objections, and other legal communications using TaxTMI's AI Drafter.
Just a moment...
Generate professional replies, appeals, opinions to Show Cause Notices, assessment orders, audit objections, and other legal communications using TaxTMI's AI Drafter.
Press 'Enter' to add multiple search terms. Rules for Better Search
Press 'Enter' after typing page number.
Press 'Enter' after typing page number.
No Folders have been created
Are you sure you want to delete "My most important" ?
NOTE:
Press 'Enter' after typing page number.
Press 'Enter' after typing page number.
All News
Press 'Enter' after typing page number.
Press 'Enter' after typing page number.
All News
Note
Bookmark
Share
Don't have an account? Register Here
Overall Merchandise and Services Exports jump 24% in May, 2022;
Merchandise exports grow by 20%; Services exports up 30%
Petroleum products, Electronic goods, Leather products, coffee, cereal preparations and oil meals lead the way in exports growth
INDIA’S FOREIGN TRADE: May 2022
India’s overall exports (Merchandise and Services combined) in May 2022* are estimated to be USD 62.21 Billion, exhibiting a positive growth of 24.03 per cent over the same period last year. The merchandise exports in May 2022 were USD 38.94 Billion, as compared to USD 32.30 Billion in May 2021, exhibiting a positive growth of 20.55 per cent. The estimated value of services export for May 2022* is USD 23.28 Billion, exhibiting a positive growth of 30.32 per cent vis-a-vis May 2021 (USD 17.86 Billion).
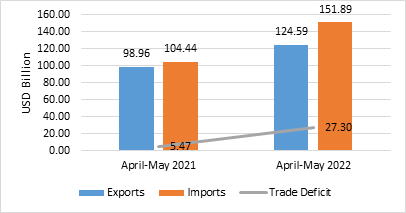
India’s overall exports (Merchandise and Services combined) in April-May 2022* are estimated to be USD 124.59 Billion, exhibiting a positive growth of 25.90 per cent over the same period last. The merchandise exports for the period April-May 2022 were USD 78.72 Billion as against USD 63.05 Billion during the period April-May 2021, registering a positive growth of 24.86 per cent. The estimated value of services export for April-May 2022* is USD 45.87 Billion, exhibiting a positive growth of 27.71 per cent vis-a-vis April-May 2021 (USD 35.92 Billion).
The overall imports (Merchandise and Services combined) in May 2022* are estimated to be USD 77.65 Billion, exhibiting a positive growth of 59.19 per cent over the same period last year. The overall imports in April-May 2022* are estimated to be USD 151.89 Billion, exhibiting a positive growth of 45.44 per cent over the same period last year.
Table 1: Trade during May 2022*
|
| May 2022 (USD Billion) | May 2021 (USD Billion) | Growth vis-à-vis May 2021 (%) |
Merchandise | Exports | 38.94 | 32.30 | 20.55 |
Imports | 63.22 | 38.83 | 62.83 | |
Trade Balance | -24.29 | -6.53 | -271.96 | |
Services* | Exports | 23.28 | 17.86 | 30.32 |
Imports | 14.43 | 9.95 | 45.01 | |
Net of Services | 8.85 | 7.91 | 11.85 | |
Overall Trade (Merchandise+ Services) * | Exports | 62.21 | 50.16 | 24.03 |
Imports | 77.65 | 48.78 | 59.19 | |
Trade Balance | -15.44 | 1.38 | -1215.73 |
* Note: The latest data for services sector released by RBI is for April 2022. The data for May 2022 is an estimation, which will be revised based on RBI’s subsequent release. (ii) Data for April-May 2021 has been revised on pro-rata basis using quarterly balance of payments data.
Table 2: Trade during April-May 2022*
|
| April-May 2022 (USD Billion) | April-May 2021 (USD Billion) | Growth vis-à-vis April-May 2021 (%) |
Merchandise | Exports | 78.72 | 63.05 | 24.86 |
Imports | 123.41 | 84.87 | 45.42 | |
Trade Balance | -44.69 | -21.82 | -104.80 | |
Services* | Exports | 45.87 | 35.92 | 27.71 |
Imports | 28.48 | 19.57 | 45.52 | |
Net of Services | 17.39 | 16.35 | 6.39 | |
Overall Trade (Merchandise+ Services) * | Exports | 124.59 | 98.96 | 25.90 |
Imports | 151.89 | 104.44 | 45.44 | |
Trade Balance | -27.30 | -5.47 | -398.74 |
* Note: The latest data for services sector released by RBI is for April 2022. The data for May 2022 is an estimation, which will be revised based on RBI’s subsequent release. (ii) Data for April-May 2021 has been revised on pro-rata basis using quarterly balance of payments data.
Fig 1: Overall Trade during May 2022*
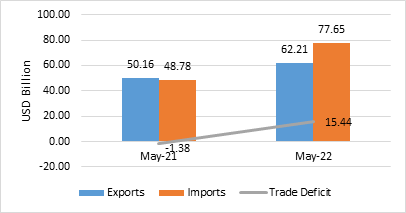
Fig 2: Overall Trade during April-May 2022*
MERCHANDISE TRADE
Fig 3: Merchandise Trade during May 2022
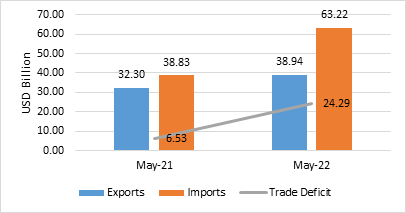
Fig 4: Merchandise Trade during April-May 2022
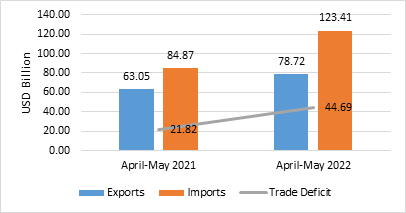
Table 3: Trade excluding Petroleum and Gems & Jewellery during May 2022
| May 2022 (USD Billion) | May 2021 (USD Billion) | Growth vis-à-vis May 2021 (%) |
Non- petroleum exports | 30.39 | 26.99 | 12.61 |
Non- petroleum imports | 44.03 | 29.36 | 49.96 |
Non-petroleum & Non Gems & Jewellery exports | 27.16 | 24.02 | 13.10 |
Non-petroleum & Non Gems & Jewellery imports | 34.79 | 26.42 | 31.66 |
Note: Gems & Jewellery Imports include Gold, Silver & Pearls, precious & Semi-precious stones
Fig 5: Trade excluding Petroleum and Gems & Jewellery during May 2022
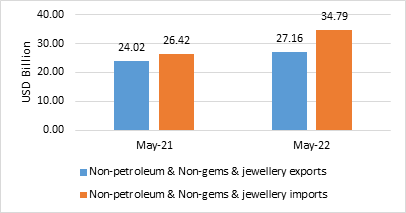
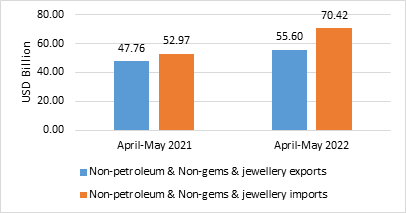
Table 4: Trade excluding Petroleum and Gems & Jewellery during April-May 2022
| April-May 2022 (USD Billion) | April-May 2021 (USD Billion) | Growth vis-à-vis April-May 2021 (%) |
Non- petroleum exports | 62.30 | 54.11 | 15.13 |
Non- petroleum imports | 84.09 | 64.63 | 30.11 |
Non-petroleum & Non Gems & Jewellery exports | 55.60 | 47.76 | 16.42 |
Non-petroleum & Non Gems & Jewellery imports | 70.42 | 52.97 | 32.94 |
Note: Gems & Jewellery Imports include Gold, Silver & Pearls, precious & Semi-precious stones
Fig 6: Trade excluding Petroleum and Gems & Jewellery during April-May 2022
SERVICES TRADE
Fig 7: Services Trade during May 2022*
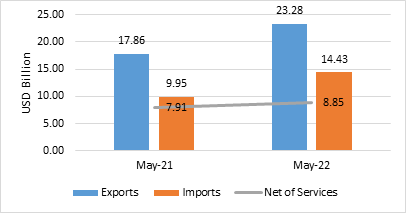
Fig 8: Services Trade during April-May 2022*
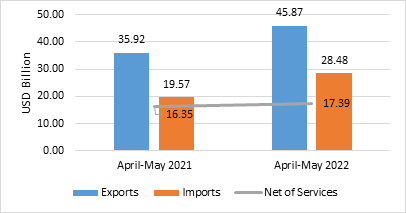
Table 5: Export Growth in Commodity Groups in May 2022
Sl. No. | Commodities | (Values in Million USD) | % Change | |
MAY'21 | MAY'22 | MAY'22 | ||
| Commodity groups exhibiting positive growth | |||
1 | Petroleum Products | 5313.28 | 8547.64 | 60.87 |
2 | Coffee | 72.75 | 111.07 | 52.67 |
3 | Leather & leather products | 271.07 | 402.61 | 48.53 |
4 | Electronic Goods | 946.66 | 1395.09 | 47.37 |
5 | Oil Meals | 67.96 | 98.62 | 45.11 |
6 | Cereal preparations & miscellaneous processed items | 165.37 | 238.04 | 43.94 |
7 | RMG of all Textiles | 1107.00 | 1415.25 | 27.85 |
8 | Jute Mfg. including Floor Covering | 35.38 | 42.94 | 21.37 |
9 | Organic & Inorganic Chemicals | 2182.94 | 2561.74 | 17.35 |
10 | Tobacco | 80.71 | 94.07 | 16.55 |
11 | Marine Products | 574.34 | 665.86 | 15.93 |
12 | Fruits & Vegetables | 178.63 | 205.79 | 15.20 |
13 | Oil seeds | 73.25 | 83.11 | 13.46 |
14 | Engineering Goods | 8623.65 | 9714.74 | 12.65 |
15 | Rice | 773.91 | 855.32 | 10.52 |
16 | Drugs & Pharmaceuticals | 1874.83 | 2067.63 | 10.28 |
17 | Ceramic products & glassware | 290.94 | 317.81 | 9.24 |
18 | Mica, Coal & Other Ores, Minerals including processed minerals | 393.93 | 429.56 | 9.04 |
19 | Gems & Jewellery | 2968.19 | 3225.46 | 8.67 |
20 | Tea | 47.99 | 49.73 | 3.63 |
21 | Man-made Yarn/Fabs./made-ups etc. | 411.03 | 422.61 | 2.82 |
22 | Meat, dairy & poultry products | 347.64 | 350.00 | 0.68 |
Sl. No. | Commodities | (Values in Million USD) | % Change | |
MAY'21 | MAY'22 | MAY'22 | ||
| Commodity Groups exhibiting negative growth | |||
23 | Iron Ore | 573.72 | 194.64 | -66.07 |
24 | Other cereals | 92.92 | 62.33 | -32.92 |
25 | Cashew | 39.01 | 27.41 | -29.74 |
26 | Handicrafts excl. handmade carpet | 146.17 | 120.06 | -17.86 |
27 | Plastic & Linoleum | 863.79 | 765.75 | -11.35 |
28 | Carpet | 138.96 | 127.26 | -8.42 |
29 | Cotton Yarn/Fabs./made-ups, Handloom Products etc. | 1106.04 | 1041.59 | -5.83 |
30 | Spices | 319.35 | 307.92 | -3.58 |
Table 6: Import Growth in Commodity Groups in May 2022
Sl. No. | Commodities | (Values in Million USD) | % Change | |
MAY'21 | MAY'22 | MAY'22 | ||
| Commodity Groups exhibiting positive growth | |||
1 | Silver | 15.39 | 446.32 | 2800.06 |
2 | Gold | 677.67 | 6025.82 | 789.20 |
3 | Coal, Coke & Briquettes, etc. | 1992.26 | 5420.90 | 172.10 |
4 | Petroleum, Crude & products | 9468.96 | 19195.84 | 102.72 |
5 | Cotton Raw & Waste | 53.48 | 96.33 | 80.12 |
6 | Leather & leather products | 56.90 | 86.34 | 51.74 |
7 | Textile yarn Fabric, made-up articles | 150.16 | 213.74 | 42.34 |
8 | Pulses | 36.98 | 52.60 | 42.24 |
9 | Fertilisers, Crude & manufactured | 661.54 | 929.89 | 40.56 |
10 | Metaliferrous ores & other minerals | 658.24 | 920.61 | 39.86 |
11 | Organic & Inorganic Chemicals | 2306.35 | 3218.90 | 39.57 |
12 | Iron & Steel | 1181.61 | 1601.14 | 35.50 |
13 | Electronic goods | 4239.80 | 5682.15 | 34.02 |
14 | Non-ferrous metals | 1262.97 | 1631.87 | 29.21 |
15 | Dyeing/tanning/colouring materials | 270.72 | 344.72 | 27.33 |
16 | Artificial resins, plastic materials, etc. | 1650.75 | 2078.17 | 25.89 |
17 | Sulphur & Unroasted Iron Pyrites | 29.08 | 36.37 | 25.07 |
18 | Pearls, precious & Semi-precious stones | 2245.03 | 2768.47 | 23.32 |
19 | Pulp and Waste paper | 123.76 | 149.02 | 20.41 |
20 | Vegetable Oil | 1432.83 | 1702.25 | 18.80 |
21 | Transport equipment | 1408.03 | 1665.39 | 18.28 |
22 | Newsprint | 24.59 | 28.23 | 14.80 |
23 | Wood & Wood products | 536.45 | 602.47 | 12.31 |
24 | Machinery, electrical & non-electrical | 2979.25 | 3306.92 | 11.00 |
25 | Fruits & vegetables | 191.66 | 206.99 | 8.00 |
Sl. No. | Commodities | (Values in Million USD) | % Change | |
MAY'21 | MAY'22 | MAY'22 | ||
| Commodity Groups exhibiting negative growth | |||
26 | Project goods | 163.81 | 60.43 | -63.11 |
27 | Professional instrument, Optical goods, etc. | 937.17 | 567.25 | -39.47 |
28 | Medicinal & Pharmaceutical products | 813.53 | 695.42 | -14.52 |
29 | Machine tools | 362.17 | 324.87 | -10.30 |
30 | Chemical material & products | 1062.04 | 1050.03 | -1.13 |
Table 7: MERCHANDISE TRADE
EXPORTS & IMPORTS: (Rs. Crore) | ||
(PROVISIONAL) | ||
| MAY | APRIL-MAY |
EXPORTS (including re-exports) |
|
|
2021-22 | 2,36,647.91 | 4,65,628.51 |
2022-23 | 3,01,058.33 | 6,04,087.81 |
%Growth 2022-23/2021-22 | 27.22 | 29.74 |
IMPORTS |
|
|
2021-22 | 2,84,484.37 | 6,27,348.71 |
2022-23 | 4,88,832.60 | 9,47,267.48 |
%Growth 2022-23/2021-22 | 71.83 | 51.00 |
TRADE BALANCE |
|
|
2021-22 | -47,836.46 | -1,61,720.20 |
2022-23 | -1,87,774.27 | -3,43,179.67 |
Table 8: SERVICES TRADE
EXPORTS & IMPORTS (SERVICES) : (US $ Billion) | |
(PROVISIONAL) | April 2022 |
EXPORTS (Receipts) | 22.59 |
IMPORTS (Payments) | 14.05 |
TRADE BALANCE | 8.54 |
|
|
EXPORTS & IMPORTS (SERVICES): (Rs. Crore) | |
(PROVISIONAL) | April 2022 |
EXPORTS (Receipts) | 1,72,093.53 |
IMPORTS (Payments) | 1,07,030.99 |
TRADE BALANCE | 65,062.53 |
Source: RBI Press Release dated 1st June 2022 | |
***
Exports Growth signals stronger receipts but faster import expansion widened the trade deficit. Overall exports of merchandise and services expanded in May 2022 and in April-May 2022, with merchandise and services exports both rising but imports increasing at a faster pace, thereby widening the merchandise and overall trade deficits. Sectoral gains were concentrated in petroleum products, electronic goods, leather products, selected agricultural and processed items, engineering goods and pharmaceuticals, while several commodities (notably iron ore and certain cereals) showed declines. Services May data are estimated pending RBI releases and April-May 2021 comparators were pro rata revised.Press 'Enter' after typing page number.