

Loading...

Top
Help
×

By creating an account you can:

Logo TaxTMI
Call Us / Help / Feedback

Contact Us At :

E-mail: [email protected]

Call / WhatsApp at: +91 99117 96707

For more information, Check Contact Us

FAQs :

To know Frequently Asked Questions, Check FAQs

Most Asked Video Tutorials :

For more tutorials, Check Video Tutorials

Submit Feedback/Suggestion :

Email :
Please provide your email address so we can follow up on your feedback.
Category :
Description :
Min 15 characters 0/2000
Make Most of Text Search
  1. Checkout this video tutorial: How to search effectively on TaxTMI.
  2. Put words in double quotes for exact word search, eg: "income tax"
  3. Avoid noise words such as : 'and, of, the, a'
  4. Sort by Relevance to get the most relevant document.
  5. Press Enter to add multiple terms/multiple phrases, and then click on Search to Search.
  6. Text Search
  7. The system will try to fetch results that contains ALL your words.
  8. Once you add keywords, you'll see a new 'Search In' filter that makes your results even more precise.
  9. Text Search
Add to...
You have not created any category. Kindly create one to bookmark this item!
Create New Category
Hide
Title :
Description :
❮❮ Hide
Default View
Expand ❯❯
Close ✕
🔎 News - Adv. Search
TEXT SEARCH:

Press 'Enter' to add multiple search terms. Rules for Better Search

Search In:
Main Text + AI Text
  • Main Text
  • Main Text + AI Text
  • AI Text
Category: ?
Categorized by AI
---- All Categories ----
  • ---- All Categories ----
  • Income Tax
  • GST
  • Customs, DGFT & SEZ
  • FEMA & RBI
  • Corp. Laws, SEBI & IBC
  • PMLA, Black Money & ED
  • Budget
  • News and Press Release
  • PTI News
Month:
---- All Months ----
  • ---- All Months ----
  • January
  • February
  • March
  • April
  • May
  • June
  • July
  • August
  • September
  • October
  • November
  • December
Year:
---- All Years ----
  • ---- All Years ----
  • 2026
  • 2025
  • 2024
  • 2023
  • 2022
  • 2021
  • 2020
  • 2019
  • 2018
  • 2017
  • 2016
  • 2015
  • 2014
  • 2013
  • 2012
  • 2011
Sort By: ?
In Sort By 'Default', exact matches for text search are shown at the top, followed by the remaining results in their regular order.
Relevance Default Date
    Decentro Wins Three Industry Honours for Fintech Infrastructure Innovation and Leadership in 2026
    Marching ahead with Responsibility and Growth - Keynote Address[Contributions by RBI colleague Shri Mohammed Majidullah, General Manager] delivered by...
    CCI directs Trustees’ Association of India, IDBI Trusteeship Services Ltd, Axis Trustee Services and SBI CAP Trustee Company to cease and desist fro...
    The Digital Textile Printer Revolution: How Konica Minolta NASSENGER is Preparing India for the Next Global Textile Opportunity
    Union minister Goyal hails 7.8 pc GDP growth; lauds Modi, takes dig at Oppn
    SC disposes of SEBI's pleas against NSE after Rs 1500-crore settlement
    India-US trade pact to be finalised once US offers preferential rate: Goyal
    Business Nextgen Finance Raises Rs 215 Crore in Equity to Accelerate MSME Lending
    Drugs: ED raids in 4 states; over 2 dozen offenders, foreign links under scanner
    Razorpay Launches a Conversational AI Account Manager 'RAY' on WhatsApp For Businesses, in Partnership with IndusInd Bank
    AssetPlus Launches Portfolio Management Services to Help MFD Partners Grow and Retain High-Net-Worth Clients
    APEDA Facilitates Flag-Off of 18 MT of NPOP-Certified Ethnic Rice from Tripura for Export to Austria and the Netherlands
    VR LIVIN’s ‘THE FIRST’ Records Sale of 20 Villas Within Two Days of Launch
    IAAPI Calls for GST Rationalisation to Support Growth and Consumer Demand in India’s Amusement Industry
    ED raids multiple locations in Keralam in hybrid ganja smuggling money laundering case
    Rupee jumps 47 paise to 94.26 against US dollar in early trade
    ED raids multiple locations in Kolkata in bank loan fraud case
    Commerce & Industry Minister Shri Piyush Goyal Calls Upon Auto Component Industry To Go Global
    18th Meeting of Heads of IP Offices of BRICS Countries Held in New Delhi
    India’s Sovereign Credit Rating upgraded to 'A-' with Stable Outlook by Japan Credit Rating Agency
❯❯
Maximize Maximize Maximize
0 / 200
Expand Note
Add to Folder

No Folders have been created

+

Are you sure you want to delete "My most important" ?

NOTE:

News
Showing Results for :
Reset Filters
Results Found:
Show All Summaries Hide All Summaries
September 3, 2026
Show AI Summary
Regulated fintech infrastructure recognition highlights integrated payment, identity and collections capabilities across embedded financial product delivery.
Decentro operates an integrated fintech infrastructure platform combining payment acceptance, identity verification, banking and AI-led collections through a unified integration layer. It holds Payment Aggregator authorisations for online and physical payments, a Payment Service Provider licence through its GIFT City entity, and certification for offline identity-verification workflows. These capabilities support embedded financial products, payment acceptance, lending collections and related financial workflows for enterprise users.
September 3, 2026
Show AI Summary
Responsible NBFC and HFC growth requires technology-enabled inclusion, proportionate regulation, sound governance, liquidity discipline, customer protection and cyber resilience.
NBFCs and HFCs can complement bank-led credit delivery through last-mile reach, sector-specific expertise, digital infrastructure, consent-based data sharing and cash-flow-based underwriting. Sustainable growth requires strong liquidity risk management, governance, compliance culture, diversified funding, stress testing, early-warning systems, dynamic provisioning and sound underwriting standards. Proportionate scale-based regulation, digital lending standards and a substance-over-form approach seek to support innovation while preserving financial stability. Customer protection, responsible lending, grievance redressal, fair recovery conduct, cyber resilience and protection of customer data remain essential.
September 3, 2026
Show AI Summary
Debenture trusteeship fee fixing constitutes cartelisation by constraining independent pricing and restricting service availability in the market.
Collective minimum-fee fixing for debenture trusteeship services prevented trustees from making independent commercial pricing decisions and constituted cartelisation. Prescription of a benchmark fee limited and controlled the supply or market for such services by directing association members and non-members not to serve debenture issuers below that fee. The conduct contravened Section 3(3)(a) and Section 3(3)(b) read with Section 3(1) of the Competition Act, 2002.
September 3, 2026
Show AI Summary
Digital textile printing enables flexible industrial production, shorter lead times, reduced screen dependency and sustainability-focused manufacturing for export markets.
Digital textile printing is presented as an industrial alternative to conventional screen printing, allowing direct production from digital design files with faster design changes, shorter lead times and flexibility across varying order quantities. Single-pass systems support high-volume production through fixed printing units and continuous fabric movement, while multipass platforms provide flexible production across natural, synthetic and specialised textiles. Digital production is associated with printing closer to demand, eliminating physical screens, reducing unnecessary production, and addressing wastewater reduction, chemical compliance, traceability and responsible manufacturing expectations.
September 3, 2026
Show AI Summary
Economic growth and infrastructure investment were presented as supporting exports, skilled employment, connectivity, and long-term development.
Economic growth, export expansion and infrastructure investment are presented as interconnected drivers of India's development, global standing and employment opportunities. Infrastructure expenditure, railway expansion and improved transport connectivity are identified as measures intended to facilitate movement, simplify transportation, support trade and exports, and strengthen industrial and commercial activity. These measures are associated with the objective of a developed India by 2047 and enhanced employment, business and growth opportunities.
September 3, 2026
Show AI Summary
Co-location and dark fibre settlement addressed allegations of preferential market-data access and speed advantages in trading.
SEBI's co-location and dark fibre matters involving NSE concerned allegations that certain stockbrokers obtained unfair preferential speed advantages to access market data and execute trades ahead of other investors. NSE pursued settlement applications covering both matters, and revised settlement terms increased the cumulative amount. Payments made by NSE together completed the agreed settlement amount.
September 3, 2026
Show AI Summary
Preferential tariff treatment remains the condition for finalising the bilateral trade agreement and improving Indian export competitiveness.
Finalisation of the India-US Bilateral Trade Agreement is contingent on the United States extending preferential tariff treatment to India relative to competing supplier countries. Further negotiations are required following changes in the United States tariff environment. A comparative tariff advantage is intended to improve the price competitiveness of Indian goods in the United States market, particularly against competitors benefiting from lower duties under least-developed-country preferences or trade agreements.
September 3, 2026
Show AI Summary
MSME secured lending equity capital, subject to regulatory approval, supports expansion without management-control change in operations.
Business Nextgen Finance Private Limited, a non-deposit taking non-banking financial company registered with the Reserve Bank of India, has raised Rs 215 crore in equity capital to expand secured credit for micro, small and medium enterprises. The transaction received prior Reserve Bank of India approval. The capital base will support secured lending scale-up, geographic expansion, technology investment and wider access to formal credit in underserved markets. The investment does not involve a change in management or day-to-day control.
September 3, 2026
Show AI Summary
Money-laundering probes into narcotics trafficking rely on predicate police and narcotics cases and examine cross-border linkages.
Money-laundering investigation under the Prevention of Money Laundering Act involves coordinated searches in connection with multiple narcotics-trafficking matters. The investigation is founded on police and Narcotics Control Bureau FIRs and linked chargesheets concerning separate drug-trafficking allegations, including alleged trafficking in methamphetamine, marijuana and MDMA with suspected cross-border linkages.
September 3, 2026
Show AI Summary
Conversational AI account management enables businesses to access payment information, settlement support, refunds, and payment links through WhatsApp.
RAY is a conversational AI account manager on WhatsApp that enables businesses to access payment information, support, and operational actions through messages or voice notes. It can provide payment summaries, analyse payment activity, monitor settlement status, generate payment links, and issue refunds. The AI assistant is designed to proactively identify payment-health issues, flag settlement events, recommend actions, and use merchant-specific context to support payment management without dashboard navigation.
September 3, 2026
Show AI Summary
Portfolio management services distribution enables certified mutual fund distributors to digitally onboard and report for eligible high-net-worth clients through AssetPlus.
AssetPlus has launched Portfolio Management Services for certified Mutual Fund Distributor partners to digitally onboard, track, manage and report PMS investments for eligible high-net-worth clients. PMS distribution requires NISM Series-XXI-A certification and operates within the APRN distributor-registration framework. PMS comprises individually managed portfolios run by SEBI-registered Portfolio Managers and held in clients' demat accounts. The minimum investment is Rs. 50 lakh, and offerings are governed by the SEBI (Portfolio Managers) Regulations, 2020. The platform provides daily reconciliation of holdings, performance and valuations.
September 3, 2026
Show AI Summary
NPOP-certified ethnic rice exports strengthen organic producer access to international markets through certification, traceability, and organised export production.
NPOP-certified ethnic rice exports from Tripura to Austria and the Netherlands connect local farmers and Farmer Producer Companies with international markets through organised, export-oriented production. The initiative emphasises certification, traceability, food safety and quality as requirements for access to markets for certified organic products. Buyer-seller linkages support export opportunities, while coordinated organic value-chain engagement strengthens certification and quality systems and supports producers in meeting international standards.
September 3, 2026
Show AI Summary
Gated residential community launch combines smart-home villas, extensive lifestyle amenities and planned expansion into future residential developments.
VR LIVIN Ventures LLP launched 'THE FIRST', an 83-villa gated residential community in Madhavaram, North Chennai, which recorded sales of 20 villas during its first two launch days. The development includes smart-home villas and more than 50 lifestyle amenities, with access to nearby metro connectivity and social infrastructure. It forms part of the company's intended expansion of residential projects in Chennai and other South Indian locations.
September 3, 2026
Show AI Summary
GST rationalisation for amusement park admissions could lower ticket prices, stimulate consumer demand, and support investment without input tax credit.
GST rationalisation for amusement park, water park and indoor entertainment admission tickets is sought through a flat 5% GST rate without Input Tax Credit. The proposed rate is intended to reduce ticket prices, improve affordability and increase customer demand in a capital-intensive tourism and entertainment sector. Many smaller and mid-sized operators report limited ability to offset GST liability through ITC. Lower taxation is projected to support facility expansion, revenue growth, new investment, employment and reinvestment in recreational services.
September 3, 2026
Show AI Summary
Money laundering linked to hybrid ganja smuggling involves alleged illicit cross-border transfers and foreign-exchange violations.
Enforcement Directorate searches form part of a money-laundering investigation into alleged hybrid ganja smuggling from Thailand. A case under the Prevention of Money Laundering Act concerns suspected laundering of drug-trafficking proceeds and transfer of funds to Thailand through illegal channels. The inquiry also examines possible foreign-exchange violations and an alleged arrangement involving carriers, visas and funds for transporting narcotic substances.
September 3, 2026
Show AI Summary
Foreign-currency deposit mobilisation supports currency appreciation while creating surplus-liquidity sterilisation pressures through deposit swaps in domestic banking markets.
Foreign-currency deposit mobilisation strengthened foreign-exchange liquidity and supported rupee appreciation. FCNR(B) deposits, together with overseas foreign-currency borrowings and external commercial borrowings, increased aggregate foreign-currency resources. Bank swaps of such deposits with the central bank may create surplus banking-system liquidity and a sterilisation challenge, while oil prices, global yields, dollar movements and foreign equity inflows remain relevant currency-market factors.
September 3, 2026
Show AI Summary
Money laundering investigation examines alleged diversion of bank loans from a power project to group entities and personal use.
Money laundering investigation under the Prevention of Money Laundering Act concerns alleged diversion of bank loans obtained by Kohinoor Power for a power plant in Jharkhand. The loan proceeds were allegedly transferred to other group entities and used personally. Searches were conducted at eleven premises associated with the group's promoters, directors and auditors. The company entered liquidation proceedings before the National Company Law Tribunal, with limited recovery for creditors.
September 3, 2026
Show AI Summary
Globalisation of auto component manufacturing is linked to trade access, resilient supply chains, technology adoption, safety, and vehicle scrappage.
The auto component industry is encouraged to expand globally through reciprocal market access, overseas manufacturing, international investment and trade partnerships. Supply-chain resilience is to be strengthened through indigenisation of vulnerable products, access to critical minerals, and domestic capacity in auto components, speciality steel, technical textiles and semiconductors. Priority is also given to high-value integrated solutions, artificial intelligence-enabled quality control, vehicle safety and industrial parks offering manufacturing infrastructure. Vehicle scrappage requires coordinated government incentives and fair industry valuation to support replacement demand for new-age vehicles.
September 3, 2026
Show AI Summary
Updated IP cooperation guidelines strengthen cross-border innovation, patent examination coordination, traditional knowledge protection, and geographical indication commercialisation.
IP BRICS Heads adopted Updated Operational Guidelines to direct result-oriented intellectual property cooperation, promote cross-border innovation, and reinforce joint engagement in global IP standards. Priority areas include protection of traditional knowledge and traditional systems of medicine, reinforced patent examination cooperation, exchange of search results, patent analytics, and geographical indication protection and commercialisation. Coordination mechanisms and periodic progress reviews are emphasised for effective implementation and continuity of cooperation.
September 3, 2026
Show AI Summary
Sovereign credit rating upgrade reflects resilient growth, improved fiscal expenditure quality, stronger financial systems, and a robust external position.
India's long-term foreign-currency and local-currency issuer ratings were upgraded from 'BBB+' to 'A-', with a Stable Outlook, reflecting resilient economic growth, improved fiscal expenditure quality, strengthened financial-sector soundness, and a robust external position. Fiscal improvement is linked to greater capital expenditure and lower fiscal deficit. Financial resilience is supported by improved banking and non-banking sector asset quality and capital adequacy. External strength arises from a contained current account deficit, services surplus, and foreign-exchange reserves exceeding short-term external debt.

News

Back

All News

Showing Results for :
Reset Filters
No Records Found

News

Showing Results for : Reset Filters
Customs, DGFT & SEZ

India’s Services exports for the first time achieve the targeted $ 250 Billion during April-March 2021-22, exhibiting a positive growth of 21.31 per cent over the fiscal 2020-21

April 14, 2022

Contents
Summary
Note

Note

-

Bookmark

Print

Print

India’s Services exports for the first time achieve the targeted $ 250 Billion during April-March 2021-22, exhibiting a positive growth of 21.31 per cent over the fiscal 2020-21

India’s overall exports (Merchandise and Services) touch an all-time high of USD 669.65 Billion in April-March 2021-22, jumping by 34.50 per cent over the same period last year

“Services sector achieved the all-time high despite Services like Tourism, Aviation and Hospitality industry being severely affected due to the Covid-19 pandemic”: Shri Piyush Goyal

India’s exports grow by 15.51 per cent in March 2022 to USD 64.75 Billion over same period last year

INDIA’S FOREIGN TRADE: March 2022

India’s Services exports for the first time achieved the targeted $ 250 Billion during April-March 2021-22*, exhibiting a positive growth of 21.31 per cent over the fiscal 2020-21. For the month of March 2022, the estimated value of Services export is USD 22.52 Billion, exhibiting a positive growth of 8.31 per cent vis-a-vis March 2021.

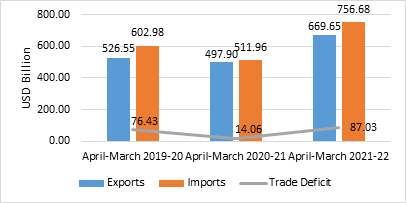
India’s overall exports (Merchandise and Services) touched an all-time high of USD 669.65 Billion in April-March 2021-22, jumping by 34.50 per cent over the same period last year. For the last month, March 2022, India’s exports grew by 15.51 per cent in March 2022 to USD 64.75 Billion over the same period last year.

Addressing a press conference here, the Minister of Commerce and Industry, Consumer Affairs, Food and Public Distribution and Textiles, Shri Piyush Goyal said India has achieved this exports high despite the slowdown in economy worldwide due to the Covid-19 pandemic and the recent geopolitical developments in Europe.

 “Services sector has achieved the all-time high despite Services like Tourism, Aviation and Hospitality industry being severely affected due to the Covid-19 pandemic,” he said.

 Shri Goyal said India has been able to exceed the overall exports target of $ 650 Billion due to the visionary leadership of the Prime Minister Shri Narendra Modi that we turn India into an export focussed economy. “The PM himself conducted meetings with India’s 180 missions abroad. Hectic parleys were held with the Export Promotion Councils and then the bar was set high, and yet doable,” he said.

 Shri Goyal said if we have to make India a developed nation, we will have to increase our international engagement. Government has struck vital trade deals with the UAE and Australia towards this end, he said, adding more FTAs and Comprehensive Trade Agreements are in the works with the EU, UK, Canada and Israel.

 “Starting from ‘whole of the Government’ approach, today ‘Whole of the Nation’ has joined hands to make India emerge as a trusted partner at the international level, dedicating itself to turn into an economy that provides quality goods and services to the world,” he said.

 Following are details of India’s Trade Data statistics:

 India’s overall exports (Merchandise and Services combined) in April-March 2021-22* are estimated to be USD 669.65 Billion, exhibiting a positive growth of 34.50 per cent over the same period last year and a positive growth of 27.18 per cent over April-March 2019-20. Overall imports in April-March 2021-22* are estimated to be USD 756.68 Billion, exhibiting a positive growth of 47.80 per cent over the same period last year and a positive growth of 25.49 per cent over April-March 2019-20.

Table 2: Trade during April-March 2021-22*


April-March 2021-22

(USD Billion)

April-March 2020-21

(USD Billion)

April-March 2019-20

(USD Billion)

Growth vis-à-vis April-March 2020-21 (%)

Growth vis-à-vis April-March 2019-20 (%)

Merchandise

Exports

419.65

291.81

313.36

43.81

33.92

Imports

611.89

394.44

474.71

55.13

28.90

Trade Balance

-192.24

-102.63

-161.35

-87.32

-19.15

Services*

Exports

250.00

206.09

213.19

21.31

17.27

Imports

144.79

117.52

128.27

23.20

12.88

Net of Services

105.21

88.57

84.92

18.80

23.89

Overall Trade (Merchandise+

Services)*

Exports

669.65

497.90

526.55

34.50

27.18

Imports

756.68

511.96

602.98

47.80

25.49

Trade Balance

-87.03

-14.06

-76.43

-518.87

-13.87

* Note: The latest data for services sector released by RBI is for February 2022. The data for March 2022 is an estimation, which will be revised based on RBI’s subsequent release. (ii) Data for 2019, 2020 and April to December 2021 are revised on pro-rata basis using quarterly balance of payments data.

Fig 2: Overall Trade during April-March 2022*
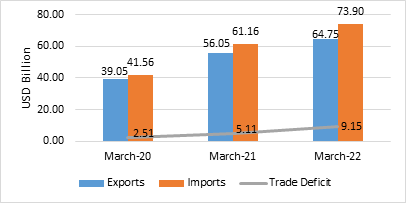
  • India’s overall exports (Merchandise and Services combined) in March 2022* are estimated to be USD 64.75 Billion, exhibiting a positive growth of 15.51 per cent over the same period last year and a positive growth of 65.80 per cent over March 2020. Overall imports in March 2022* are estimated to be USD 73.90 Billion, exhibiting a positive growth of 20.83 per cent over the same period last year and a positive growth of 77.82 per cent over March 2020.

Table 1: Trade during March 2022*


March 2022

(USD Billion)

March 2021

(USD Billion)

March 2020

(USD Billion)

Growth vis-à-vis March 2021 (%)

Growth vis-à-vis March 2020 (%)

Merchandise

Exports

42.22

35.26

21.49

19.76

96.48

Imports

60.74

48.90

31.47

24.21

93.00

Trade Balance

-18.51

-13.64

-9.98

-35.72

-85.51

Services*

Exports

22.52

20.80

17.56

8.31

28.25

Imports

13.16

12.26

10.09

7.33

30.46

Net of Services

9.36

8.53

7.47

9.71

25.28

Overall Trade (Merchandise+

Services)*

Exports

64.75

56.05

39.05

15.51

65.80

Imports

73.90

61.16

41.56

20.83

77.82

Trade Balance

-9.15

-5.11

-2.51

-79.18

-265.14

* Note: The latest data for services sector released by RBI is for February 2022. The data for March 2022 is an estimation, which will be revised based on RBI’s subsequent release. (ii) Data for 2019, 2020 and April to December 2021 are revised on pro-rata basis using quarterly balance of payments data.

Fig 1: Overall Trade during March 2022*
MERCHANDISE TRADE

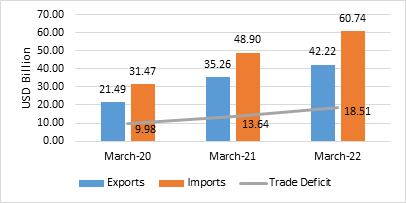
  • Merchandise exports in March 2022 were USD 42.22 Billion, as compared to USD 35.26 Billion in March 2021, exhibiting a positive growth of 19.76 per cent. As compared to March 2020, exports in March 2022 exhibited a positive growth of 96.48 per cent.
  • Merchandise imports in March 2022 were USD 60.74 Billion, which is an increase of 24.21 per cent over imports of USD 48.90 Billion in March 2021. Imports in March 2022 have registered a positive growth of 93.00 per cent in comparison to March 2020.
  • The merchandise trade balance for March 2022 was estimated at USD (-) 18.51 Billion as against USD (-) 13.64 Billion in March 2021, which is a decline of (-) 35.72 per cent. As compared to March 2020 (USD (-) 9.98 Billion), trade balance in March 2022 exhibited a negative growth of (-) 85.51 per cent.


Fig 3: Merchandise Trade during March 2022
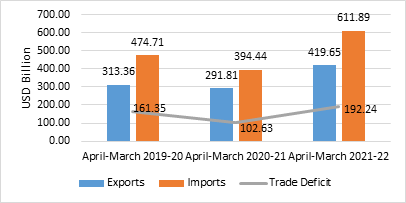
  • Merchandise exports for the period April-March 2021-22 was USD 419.65 Billion as against USD 291.81 Billion during the period April-March 2020-21, registering a positive growth of 43.81 per cent. As compared to April-March 2019-20, exports in April-March 2021-22 exhibited a positive growth of 33.92 per cent.
  • Merchandise imports for the period April-March 2021-22 was USD 611.89 Billion as against USD 394.44 Billion during the period April-March 2020-21, registering a positive growth of 55.13 per cent. Imports in April-March 2021-22 have registered a positive growth of 28.90 per cent in comparison to April-March 2019-20.
  • The merchandise trade balance for April-March 2021-22 was estimated at USD (-) 192.24 Billion as against USD (-) 102.63 Billion in April-March 2020-21, which is a decline of (-) 87.32 per cent. As compared to April-March 2019-20 (USD (-) 161.35 Billion), trade balance in April-March 2021-22 exhibited a negative growth of (-) 19.15 per cent.

Fig 4: Merchandise Trade during April-March 2021-22
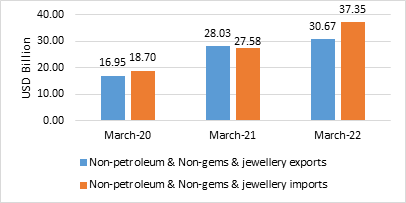
  • Non-petroleum and non-gems & jewellery exports in March 2022 were USD 30.67 Billion, registering a positive growth of 9.40 per cent over non-petroleum and non-gems & jewellery exports of USD 28.03 Billion in March 2021 and a positive growth of 80.90 per cent over non-petroleum and non-gems & jewellery exports of USD 16.95 Billion in March 2020.
  • Non-petroleum, non-gems & jewellery (gold, silver & precious metals) imports were USD 37.35 Billion in March 2022 with a positive growth of 35.44 per cent over Non-petroleum, non-gems & jewellery imports of USD 27.58 Billion in March 2021 and a positive growth of 99.77 per cent over Non-petroleum, non-gems & jewellery imports of USD 18.70 Billion in March 2020.

 Table 3: Trade excluding Petroleum and Gems & Jewellery during March 2022


March 2022

(USD Billion)

March 2021

(USD Billion)

March 2020

(USD Billion)

Growth vis-à-vis March 2021 (%)

Growth vis-à-vis March 2020 (%)

Non- petroleum exports

34.45

31.65

18.97

8.85

81.57

Non- petroleum imports

41.95

38.63

21.42

8.59

95.79

Non-petroleum & Non Gems & Jewellery exports

30.67

28.03

16.95

9.40

80.90

Non-petroleum & Non Gems & Jewellery imports*

37.35

27.58

18.70

35.44

99.77

Note: Gems & Jewellery Imports include Gold, Silver & Pearls, precious & Semi-precious stones

Fig 5: Trade excluding Petroleum and Gems & Jewellery during March 2022
 

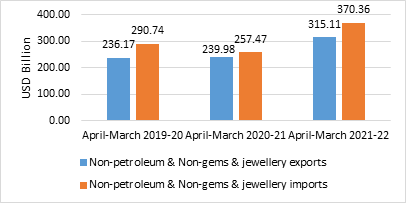
  • Non-petroleum and non-gems & jewellery exports during April-March 2021-22 was USD 315.11 Billion, an increase of 31.31 per cent over non-petroleum and non-gems & jewellery exports of USD 239.98 Billion in April-March 2020-21 and an increase of 33.42 per cent over non-petroleum and non-gems & jewellery exports of USD 236.17 Billion in April-March 2019-20.
  • Non-petroleum, non-gems & jewellery (gold, silver & precious metals) imports were USD 370.36 Billion in April-March 2021-22, recording a positive growth of 43.85 per cent, as compared to Non-petroleum, non-gems & jewellery imports of USD 257.47 Billion in April-March 2020-21 and a positive growth of 27.38 per cent over USD 290.74 Billion in April-March 2019-20.

Table 4: Trade excluding Petroleum and Gems & Jewellery during April-March 2021-22


April-March 2021-22

(USD Billion)

April-March 2020-21

(USD Billion)

April-March 2019-20

(USD Billion)

Growth vis-à-vis April-March 2020-21 (%)

Growth vis-à-vis April-March 2019-20 (%)

Non- petroleum exports

354.21

266.00

272.07

33.16

30.19

Non- petroleum imports

450.82

311.75

344.16

44.61

30.99

Non-petroleum & Non Gems & Jewellery exports

315.11

239.98

236.17

31.31

33.42

Non-petroleum & Non Gems & Jewellery imports*

370.36

257.47

290.74

43.85

27.38

Note: Gems & Jewellery Imports include Gold, Silver & Pearls, precious & Semi-precious stones

  Fig 6: Trade excluding Petroleum and Gems & Jewellery during April-March 2021-22
SERVICES TRADE

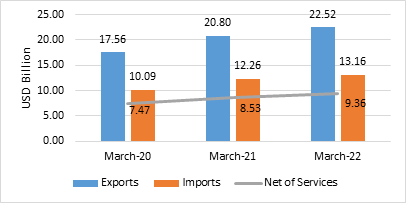
  • The estimated value of services export for March 2022* is USD 22.52 Billion, exhibiting a positive growth of 8.31 per cent vis-a-vis March 2021 (USD 20.80 Billion) and a positive growth of 28.25 per cent vis-à-vis March 2020 (USD 17.56 Billion).
  • The estimated value of services import for March 2022* is USD 13.16 Billion exhibiting a positive growth of 7.33 per cent vis-à-vis March 2021 (USD 12.26 Billion) and a positive growth of 30.46 per cent vis-à-vis March 2020 (USD 10.09 Billion).
  • The services trade balance in March 2022* is estimated at USD 9.36 Billion, which is an increase of 9.71 per cent over March 2021 (USD 8.53 Billion) and an increase of 25.28 per cent over March 2020 (USD 7.47 Billion).

Fig 7: Services Trade during March 2022*
  • The estimated value of services export for April-March 2021-22* is USD 250.00 Billion, exhibiting a positive growth of 21.31 per cent vis-a-vis April-March 2020-21 (USD 206.09 Billion) and a positive growth of 17.27 per cent vis-à-vis April-March 2019-20 (USD 213.19 Billion).
  • The estimated value of services imports for April-March 2021-22* is USD 144.79 Billion exhibiting a positive growth of 23.20 per cent vis-à-vis April-March 2020-21 (USD 117.52 Billion) and a positive growth of 12.88 per cent vis-à-vis April-March 2019-20 (USD 128.27 Billion).
  • The services trade balance for April-March 2021-22* was estimated at USD 105.21 Billion as against USD 88.57 Billion in April-March 2020-21, which is an increase of 18.80 per cent. As compared to April-March 2019-20 (USD 84.92 Billion), net of services in April-March 2021-22* exhibited a positive growth of 23.89 per cent. 

Fig 8: Services Trade during April-March 2021-22*
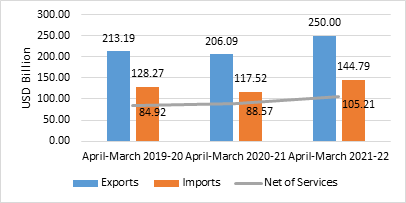
 Table 5: Export Growth in Commodity Groups in March 2022

Sl. No.

Commodities

(Values in Million USD)

% Change

MAR'21

MAR'22

MAR'22


Commodity groups exhibiting positive growth

1

Petroleum Products

3609.36

7775.16

115.42

2

Leather & leather products

317.79

413.11

29.99

3

Electronic Goods

1400.67

1818.42

29.82

4

Cereal preparations & miscellaneous processed items

191.60

242.02

26.32

5

Other cereals

78.80

97.04

23.15

6

RMG of all Textiles

1425.95

1740.35

22.05

7

Organic & Inorganic Chemicals

2288.87

2793.18

22.03

8

Cotton Yarn/Fabs./made-ups, Handloom Products etc.

1105.05

1342.97

21.53

9

Plastic & Linoleum

719.54

850.71

18.23

10

Coffee

97.41

114.70

17.75

11

Engineering Goods

9298.36

10877.53

16.98

12

Man-made Yarn/Fabs./made-ups etc.

459.94

527.69

14.73

13

Jute Mfg. including Floor Covering

44.48

49.29

10.82

14

Tea

53.38

58.27

9.16

15

Marine Products

554.25

598.23

7.93

16

Meat, dairy & poultry products

345.05

368.68

6.85

17

Gems & Jewellery

3613.01

3779.52

4.61

18

Ceramic products & glassware

323.45

337.79

4.43

19

Drugs & Pharmaceuticals

2295.05

2391.41

4.20

20

Tobacco

85.62

86.42

0.93

Sl. No.

Commodities

(Values in Million USD)

% Change

MAR'21

MAR'22

MAR'22


Commodity Groups exhibiting negative growth

21

Iron Ore

720.88

339.83

-52.86

22

Oil Meals

193.91

101.00

-47.91

23

Mica, Coal & Other Ores, Minerals including processed minerals

952.95

569.88

-40.20

24

Oil seeds

107.67

87.56

-18.68

25

Spices

447.78

388.16

-13.31

26

Rice

1116.54

1023.33

-8.35

27

Handicrafts excl. hand made carpet

176.71

174.26

-1.39

28

Carpet

157.17

155.09

-1.32

29

Fruits & Vegetables

377.10

372.72

-1.16

30

Cashew

40.44

40.09

-0.87

 Table 6: Import Growth in Commodity Groups in March 2022

Sl. No.

Commodities

(Values in Million USD)

% Change

MAR'21

MAR'22

MAR'22


Commodity Groups exhibiting positive growth

1

Silver

9.85

124.98

1168.83

2

Fertilisers, Crude & manufactured

204.16

1656.78

711.51

3

Coal, Coke & Briquettes, etc.

1735.74

4594.32

164.69

4

Pulses

77.28

142.84

84.83

5

Petroleum, Crude & products

10271.38

18793.68

82.97

6

Medicinal & Pharmaceutical products

630.08

1148.93

82.35

7

 Vegetable Oil

1076.81

1734.60

61.09

8

Pulp and Waste paper

91.38

146.03

59.81

9

Newsprint

17.54

27.74

58.15

10

Cotton Raw & Waste

40.42

61.97

53.32

11

Electronic goods

5864.15

8530.46

45.47

12

Pearls, precious & Semi-precious stones

2547.27

3428.31

34.59

13

Organic & Inorganic Chemicals

2102.57

2792.15

32.80

14

Metaliferrous ores & other minerals

455.83

586.51

28.67

15

Leather & leather products

69.35

81.49

17.51

16

Fruits & vegetables

185.43

217.48

17.28

17

Iron & Steel

1328.44

1493.30

12.41

18

Non-ferrous metals

1400.11

1572.58

12.32

19

Artificial resins, plastic materials, etc.

1719.92

1928.57

12.13

20

Sulphur & Unroasted Iron Pyrites

27.82

29.59

6.36

21

Wood &  Wood products

526.99

546.00

3.61

22

Machinery, electrical & non-electrical

3513.68

3546.06

0.92

Sl. No.

Commodities

(Values in Million USD)

% Change

MAR'21

MAR'22

MAR'22


Commodity Groups exhibiting negative growth

23

Gold

8493.69

1041.17

-87.74

24

Project goods

66.10

45.85

-30.64

25

Dyeing/tanning/colouring materials.

385.55

342.36

-11.20

26

Machine tools

355.36

325.05

-8.53

27

Transport equipment

2210.75

2032.72

-8.05

28

Professional instrument, Optical goods, etc.

560.18

532.08

-5.02

29

Textile yarn Fabric, made-up articles

167.98

163.41

-2.72

30

Chemical material & products

914.21

909.74

-0.49

 Table 7: MERCHANDISE TRADE 

EXPORTS & IMPORTS: (Rs. Crore)

(PROVISIONAL)


MARCH

APRIL-MARCH

EXPORTS(including re-exports)


2019-20

1,59,784.62

22,19,854.18

2020-21

2,56,642.68

21,59,043.22

2021-22

3,21,934.84

31,29,096.20

%Growth 2021-22/ 2020-21

25.44

44.93

%Growth 2021-22/ 2019-20

101.48

40.96

IMPORTS


2019-20

2,33,988.47

33,60,954.46

2020-21

3,55,948.52

29,15,957.70

2021-22

4,63,100.32

45,63,803.96

%Growth 2021-22/ 2020-21

30.10

56.51

%Growth 2021-22/ 2019-20

97.92

35.79

TRADE BALANCE


2019-20

-74,203.85

-11,41,100.28

2020-21

-99,305.84

-7,56,914.48

2021-22

-1,41,165.48

-14,34,707.75

 Table 8: SERVICES TRADE

EXPORTS & IMPORTS (SERVICES) : (US $ Billion)


(PROVISIONAL)

February 2022

April-

February 2021-22

EXPORTS (Receipts)

21.25

227.48

IMPORTS (Payments)

12.95

131.62

TRADE BALANCE

8.30

95.85


EXPORTS & IMPORTS (SERVICES): (Rs. Crore)


(PROVISIONAL)

February 2022

April-

February 2021-22

EXPORTS (Receipts)

1,59,381.59

16,91,958.35

IMPORTS (Payments)

97,159.02

9,79,163.99

TRADE BALANCE

62,222.57

7,12,794.35

Source: RBI Press Release dated 1st April 2022


*Link for quick Estimates

Topics

Acts Income Tax
