Just a moment...

Top
Help
×

By creating an account you can:

Logo TaxTMI
Call Us / Help / Feedback

Contact Us At :

E-mail: [email protected]

Call / WhatsApp at: +91 99117 96707

For more information, Check Contact Us

FAQs :

To know Frequently Asked Questions, Check FAQs

Most Asked Video Tutorials :

For more tutorials, Check Video Tutorials

Submit Feedback/Suggestion :

Email :
Please provide your email address so we can follow up on your feedback.
Category :
Description :
Min 15 characters0/2000
Make Most of Text Search
  1. Checkout this video tutorial: How to search effectively on TaxTMI.
  2. Put words in double quotes for exact word search, eg: "income tax"
  3. Avoid noise words such as : 'and, of, the, a'
  4. Sort by Relevance to get the most relevant document.
  5. Press Enter to add multiple terms/multiple phrases, and then click on Search to Search.
  6. Text Search
  7. The system will try to fetch results that contains ALL your words.
  8. Once you add keywords, you'll see a new 'Search In' filter that makes your results even more precise.
  9. Text Search
Add to...
You have not created any category. Kindly create one to bookmark this item!
Create New Category
Hide
Title :
Description :
❮❮ Hide
Default View
Expand ❯❯
Close ✕
🔎 News - Adv. Search
TEXT SEARCH:

Press 'Enter' to add multiple search terms. Rules for Better Search

Search In:
Main Text + AI Text
  • Main Text
  • Main Text + AI Text
  • AI Text
Category: ?
Categorized by AI
---- All Categories ----
  • ---- All Categories ----
  • Income Tax
  • GST
  • Customs, DGFT & SEZ
  • FEMA & RBI
  • Corp. Laws, SEBI & IBC
  • PMLA, Black Money & ED
  • Budget
  • News and Press Release
  • PTI News
Month:
---- All Months ----
  • ---- All Months ----
  • January
  • February
  • March
  • April
  • May
  • June
  • July
  • August
  • September
  • October
  • November
  • December
Year:
---- All Years ----
  • ---- All Years ----
  • 2026
  • 2025
  • 2024
  • 2023
  • 2022
  • 2021
  • 2020
  • 2019
  • 2018
  • 2017
  • 2016
  • 2015
  • 2014
  • 2013
  • 2012
  • 2011
Sort By: ?
In Sort By 'Default', exact matches for text search are shown at the top, followed by the remaining results in their regular order.
RelevanceDefaultDate
    Current account deficit widens to USD 6.2 bn in Jun: RBI data
    Concessional swap facility attracts USD 56.85 bn forex inflows: RBI
    DFS Highlights Mechanism for Timely Redressal of Insurance Policyholders’ Grievances
    Forex kitty jumps USD 14.14 bn to USD 707 bn in one of the biggest weekly expansions
    PROVISIONAL ESTIMATES OF WHOLESALE PRICE INDEX, OUTPUT PRODUCER PRICE INDEX, AND TRIAL INPUT PRODUCER PRICE INDEX FOR THE MONTH OF JULY 2026, AND FINA...
    Logistics Data Bank Tracks 10 Crore EXIM Containers, Provides Visibility across Logistics Chain
    APEDA and Government of Tripura Organise International Organic Buyer-Seller Meet to Expand Global Market Linkages
    WPI inflation eases to 9.78 pc in July on softening in fuel prices
    IDFC FIRST Bank secures its first international rating with Investment Grade from S&P Global Ratings
    DRI busts illegal drug manufacturing facility in Jewar, UP; 30 kg drugs seized and two persons arrested
    UCO Bank launches IFSC Banking Unit at GIFT City
    Banking sector has key role to play as India on way to become 3rd largest economy: Gujarat CM
    India's exports to US rise 12.85 pc in Jul; shipments to China jump 64.57 pc: Govt data
    50 tonnes of copper without e-way bills seized by Delhi GST, Railways joint team
    India's exports surge 19.6 pc in Jul; trade deficit widens to six-month high
    CBI ARRESTS CGST SUPERINTENDENT IN BRIBERY CASE
    The cumulative exports (merchandise & services) during April-July 2026-27 is estimated at US$ 316.42 Billion, as compared to US$ 279.63 Billion in Apr...
    Unlimit Mobile Ties Up with ICICI Bank Canada, RBC Royal Bank to Add Mobile Connectivity Benefits to Student GIC Journey
    Standard Chartered Accelerates India's GCC Growth with its Global Banking Expertise and 25 Years of GCC Experience
    IFSCA Grants Nexent Capital GIFT City Investment Banking License
❯❯
MaximizeMaximizeMaximize
0 / 200
Expand Note
Add to Folder

No Folders have been created

    +

    Are you sure you want to delete "My most important" ?

    NOTE:

    News
    Showing Results for :
    Reset Filters
    Results Found:
    Show All SummariesHide All Summaries
    August 14, 2026
    Show AI Summary
    Current account deficit widened as merchandise trade imbalance expanded, despite stronger services surplus, transfers, and positive capital inflows.
    India's current account deficit widened in June 2026, principally because merchandise imports increased faster than exports and expanded the merchandise trade deficit. A higher services surplus, increased net transfers and a narrower net income deficit provided partial offsets. Net capital inflows, including foreign direct investment and foreign portfolio investment, supported a positive overall monthly balance. During the April-June quarter, despite increased services surplus and net transfers, the overall balance shifted to a deficit as the merchandise trade deficit widened.
    August 14, 2026
    Show AI Summary
    Concessional foreign-currency swap facility closes early for new FCNR(B) deposits while ECB and OFCB access remains available.
    The concessional swap facility for FCNR(B) deposits encourages foreign-currency inflows and supports foreign-exchange liquidity. New FCNR(B) deposits eligible for the facility must be mobilised by 31 August 2026, while swaps for eligible deposits may be availed until 11 September 2026. The swap arrangement for External Commercial Borrowings and Overseas Foreign Currency Borrowings remains available until 31 December 2026.
    August 14, 2026
    Show AI Summary
    Insurance grievance redressal requires initial insurer complaint, prompt acknowledgement, and escalation through integrated monitoring channels when resolution remains unsatisfactory.
    Insurance policyholder grievances must first be raised with the concerned insurer, whose Grievance Redressal Officer and Board-level monitoring committee oversee redressal. Complaints received through digital channels, correspondence or call centres are recorded in the insurer's Complaints Management System, integrated with Bima Bharosa. Insurers must acknowledge complaints immediately and resolve them within 14 days. Where no response is received within a reasonable period or the response is unsatisfactory, policyholders may escalate through Bima Bharosa or designated helplines, email or physical correspondence.
    August 14, 2026
    Show AI Summary
    Foreign exchange reserve growth reflects increases in foreign currency assets, gold holdings, special drawing rights, and IMF reserve position.
    India's foreign exchange reserves rose to USD 707.002 billion for the week ended 7 August 2026. The increase comprised higher foreign currency assets, gold reserves, special drawing rights and the reserve position with the IMF. Foreign currency asset valuation incorporates appreciation or depreciation of non-US currencies held in reserve assets. Measures including the FCNR(B) scheme were introduced to attract additional foreign exchange inflows.
    August 14, 2026
    Show AI Summary
    Wholesale and producer price indices show July inflation movements, provisional estimates, final revisions, and manufacturing input-price trends.
    Wholesale Price Index, Output Producer Price Index, and trial Input Producer Price Index estimates under the 2022-23 base-year series set out provisional July 2026 measures and final May 2026 revisions. All-commodities WPI stood at 110.0 in July 2026, with year-on-year inflation of 9.78 per cent. The all-commodities Output PPI was unchanged at 109.9, while the trial Input PPI for manufacturing was provisionally estimated at 105.9. Final May WPI, Output PPI and trial Input PPI measures were revised from their respective provisional estimates.
    August 14, 2026
    Show AI Summary
    Logistics data visibility enables EXIM container tracking, operational analytics and multimodal shipment monitoring across India's logistics chain.
    Logistics Data Bank provides near real-time visibility of India's EXIM container movement through technology-based tracking and stakeholder monitoring tools. RFID-based coverage extends across ports, terminals, inland logistics facilities, rail networks, industrial zones, borders and highways. The platform uses RFID, Internet of Things, Big Data and Cloud technologies, with analytics on dwell time, transit time, and port and terminal performance to identify logistics bottlenecks. LDB 2.0 adds high-seas tracking of export containers and multimodal shipment visibility.
    August 14, 2026
    Show AI Summary
    International organic buyer-seller linkages support Tripura producers through direct sourcing engagement, market access and sustainable export opportunities.
    International Organic Buyer-Seller Meet in Tripura created a direct platform for organic producers, Farmer Producer Organisations, exporters and international buyers to explore sourcing opportunities, market requirements and long-term commercial linkages. Organic and naturally produced goods, including Queen Pineapple, GI-tagged Kalikhasa Rice, organic ginger and turmeric, black sesame, jackfruit and scented lemon, were showcased through product displays and producer interactions. The initiative seeks to strengthen global market access, sourcing partnerships and income opportunities for organic farmers.
    August 14, 2026
    Show AI Summary
    Wholesale price inflation moderation was driven by softer fuel prices, while manufactured goods and primary articles recorded higher inflation.
    Wholesale price inflation moderated in July, led by a decline in fuel and power inflation and a marginal easing in food-article inflation. Inflation in manufactured products and primary articles increased, making the moderation uneven across groups. Mineral oils, food articles, basic metals, non-food articles, food products, and chemical products remained significant inflation drivers. The output Producer Price Index remained unchanged year-on-year, with lower manufacturing and mining inflation offset by higher agriculture and electricity producer-price inflation.
    August 14, 2026
    Show AI Summary
    International investment-grade issuer ratings support expanded foreign-currency funding, trade finance, correspondent banking and cross-border financial market access.
    IDFC FIRST Bank's inaugural international investment-grade issuer credit ratings, with a stable outlook, are expected to improve access to international funding markets and global financial counterparties. The rating is intended to support standby letter of credit lines, foreign-currency funding through its GIFT City International Banking Unit, mobilisation of FCNR(B) deposits, correspondent banking relationships and cross-border trade finance. Strong capitalisation, improving profitability, stable asset quality and a granular retail funding profile underpin the outlook.
    August 14, 2026
    Show AI Summary
    Clandestine psychotropic drug manufacturing faces enforcement targeting precursor chemicals, concealed laboratories, illicit production networks and trafficking operations.
    Enforcement action against clandestine manufacture of psychotropic substances led to the detection of a residential drug-production facility. Searches recovered amphetamine and intermediary forms, precursor chemicals, reagents, raw materials, and manufacturing equipment. Field testing indicated the presence of amphetamine, a psychotropic substance regulated under the Narcotic Drugs and Psychotropic Substances Act, 1985. The recovered apparatus and materials indicated illicit manufacture, while preliminary investigation pointed to short-term, intermittently operated facilities intended to conceal production activities.
    August 13, 2026
    Show AI Summary
    International banking unit expands cross-border financing, trade finance and foreign-currency service access through GIFT City operations.
    UCO Bank has launched an International Financial Services Centre Banking Unit at GIFT City to provide permitted international banking services. The unit offers trade finance, external commercial borrowings, foreign-currency loans, loan syndication, treasury services and other permitted financial services. It serves Indian corporates, exporters, importers, financial institutions, overseas businesses and other eligible customers requiring cross-border financing and access to global financial markets. FCNR(B) deposits are also offered through the unit.
    August 13, 2026
    Show AI Summary
    Last-mile credit access is prioritised through timely lending, wider beneficiary coverage, digital support and stronger fraud vigilance.
    Banking-sector participation is emphasised through last-mile credit access for MSMEs, women entrepreneurs, rural artisans, small farmers and other underserved beneficiaries. Banks are urged to expedite government-scheme applications, maximise coverage and use technology for timely financial support. Industrial-policy assistance and incentives cover startups, SC/ST entrepreneurs, persons with disabilities and first-generation entrepreneurs. Greater coordination, expanded village banking access, and vigilance against cyber fraud and mule accounts are also prioritised.
    August 13, 2026
    Show AI Summary
    Merchandise trade growth saw rising exports to major markets alongside increased imports and continuing United States trade-pact negotiations.
    India's merchandise trade data records increased July exports to the United States and China, alongside growth in imports from both markets. Exports to Singapore, the United Arab Emirates, the Netherlands, Germany, South Africa, Tanzania, Australia, Malaysia, Sri Lanka, Italy and Vietnam showed positive growth, while July exports declined for the United Kingdom, Bangladesh, Saudi Arabia and Nepal. Imports also increased from Russia, Korea, Singapore, Germany, Oman, Malaysia, Taiwan and Brazil. India and the United States are negotiating a trade pact amid an additional United States tariff on India.
    August 13, 2026
    Show AI Summary
    GST transport documentation enforcement addresses freight movement of metals without valid e-way bills and invoices under applicable rules.
    GST enforcement action led to the seizure of copper and aluminium ingots transported by freight train without valid e-way bills and invoices. The metals were found in three train wagons during inspection of parcel cargo. Further proceedings are to be undertaken under applicable GST rules concerning movement of goods without prescribed transport documentation.
    August 13, 2026
    Show AI Summary
    Merchandise trade deficit widens as import growth outpaces exports despite strong petroleum, electronics and engineering shipments.
    Merchandise trade in July 2026 saw exports rise 19.63 per cent and imports increase 17.52 per cent, widening the trade deficit to a six-month high. Petroleum products, electronics, engineering goods and marine goods supported export growth, while crude oil and several commodity and capital-goods categories increased imports. During April-July 2026-27, faster import growth widened the cumulative merchandise trade deficit compared with the corresponding prior-year period.
    August 13, 2026
    Show AI Summary
    Bribery allegations in GST enforcement prompted arrest after alleged payment demand to avoid a tax-liability notice.
    Bribery allegations involving GST enforcement led to the arrest of a CGST Superintendent after a complaint alleged that payment was demanded from a private company to avoid issuance of a tax-liability demand notice and to close the matter. A trap operation resulted in the public servant being apprehended while allegedly accepting part of the demanded bribe, and the amount accepted was recovered. Searches were undertaken, and investigation remained ongoing.
    August 13, 2026
    Show AI Summary
    Trade performance shows rising merchandise and services exports, but faster import growth expands the overall trade deficit.
    India's combined merchandise and services exports and imports increased in July 2026 and April-July 2026-27, while the overall trade deficit widened. Cumulative exports were estimated at US$ 316.42 billion and imports at US$ 365.85 billion, resulting in a trade deficit of US$ 49.43 billion. Merchandise exports, non-petroleum exports, and exports excluding petroleum and gems and jewellery grew, led by petroleum products, electronic goods, engineering goods and chemicals. Services trade recorded a cumulative surplus of US$ 69.17 billion.
    August 13, 2026
    Show AI Summary
    Student GIC referral programmes integrate connectivity credits with funding verification and post-arrival banking arrangements for eligible international students.
    Referral arrangements connect mobile connectivity benefits with the Student Guaranteed Investment Certificate application journey. Applicants may access an online portal through a referral link, submit documents, complete know-your-customer verification, and fund the GIC from permitted Indian bank accounts in no more than two transactions. After arrival, students may activate the GIC account and open a linked bank account for receipt of GIC transfers. Eligible verified applicants receive non-cash mobile credits usable only against mobile bills, subject to a cap on the bill portion payable through credits.
    August 13, 2026
    Show AI Summary
    Global Capability Centre banking support connects offshore and onshore operations to simplify financial management and enable cross-border expansion.
    Global Capability Centre banking support is positioned around connected offshore and onshore banking, international network access, digital banking platforms, and expertise in treasury centres, cross-border corporates, and evolving GCC operating models. The approach seeks to simplify financial operations and support GCC expansion across global markets. India's GCC ecosystem is characterised as a leading global capability hub, with capability centres evolving into strategic enterprise hubs requiring support for operational and financial complexities across markets.
    August 13, 2026
    Show AI Summary
    Investment banking registration enables regulated cross-border offerings, listings, debt transactions and capital-market advisory through GIFT City.
    IFSCA registration under the IFSCA (Capital Market Intermediaries) Regulations, 2025 authorises Nexent Capital IFSC Private Limited to operate as an investment banker from GIFT City. Permitted activities include management of initial and follow-on public offerings, SPAC and secondary listings, depository receipt issuances, debt capital-market transactions, and other capital-market advisory mandates. The firm proposes to provide transaction structuring, listing-readiness, execution and post-listing capital-markets support for companies seeking capital raising and listing opportunities through GIFT City's exchanges.

    News

    Back

    All News

    Showing Results for :
    Reset Filters
      No Records Found

      News

      Back

      All News

      whatsappJoin Channel
      Showing Results for : Reset Filters
      Customs, DGFT & SEZ

      India achieves an all-time high annual merchandise exports, touching USD 417.81 billion in FY 2021-22, an increase of 43.18% over USD 291.81 billion in previous fiscal

      April 4, 2022

      Contents
      Summary
      Note

      Note

      -

      Bookmark

      Print

      Print

      India achieves an all-time high annual merchandise exports, touching USD 417.81 billion in FY 2021-22, an increase of 43.18% over USD 291.81 billion in previous fiscal

      For the first time, monthly merchandise exports exceed USD 40 Billion, reaching USD 40.38 billion in March 2022, an increase of 14.53% over March 2021

      INDIA’S MERCHANDISE TRADE: Preliminary Data March 2022

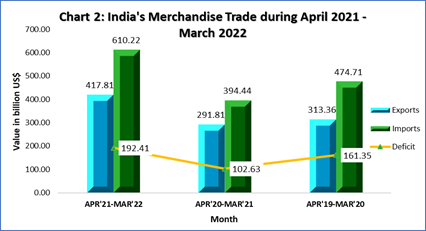
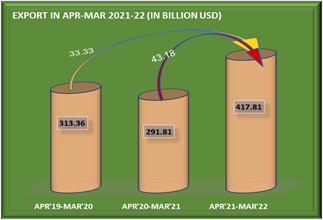
      India achieved an all-time high annual merchandise exports of USD 417.81 billion in FY 2021-22, an increase of 43.18% over USD 291.81 billion in FY2020-21 and an increase of 33.33% over USD 313.36 billion in FY2019-20.
      https://static.pib.gov.in/WriteReadData/userfiles/image/image0011JLU.png  https://static.pib.gov.in/WriteReadData/userfiles/image/image002SXFY.png

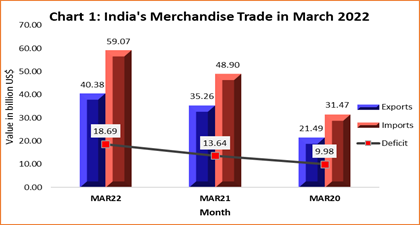
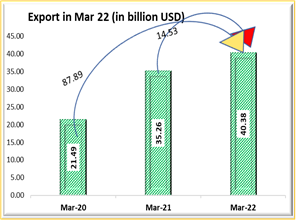
      For the first time, India’s monthly merchandise exports exceeded USD 40 Billion, reaching USD 40.38 billion in March 2022, an increase of 14.53% over USD 35.26 billion in March 2021 and an increase of 87.89% over USD 21.49 billion in March 2020.

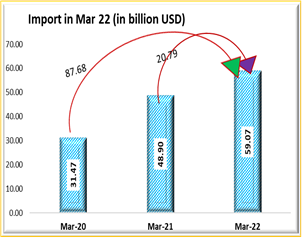
      India’s merchandise import in March 2022 was USD 59.07 billion, an increase of 20.79% over USD 48.90 billion in March 2021 and an increase of 87.68% over USD 31.47 billion in March 2020.
      https://static.pib.gov.in/WriteReadData/userfiles/image/image003E0WK.png https://static.pib.gov.in/WriteReadData/userfiles/image/image004ROTR.png

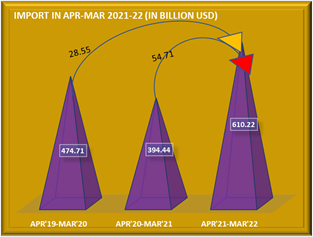
      India’s merchandise import in April 2021-March 2022 was USD 610.22 billion, an increase of 54.71% over USD 394.44 billion in April 2020-March 2021 and an increase of 28.55% over USD 474.71 billion in April 2019-March 2020.

      The trade deficit in March 2022 was USD 18.69 billion, while it was USD 192.41 billion during April 2021-March 2022.

      Statement 1: India’s Total Trade in Merchandise goods in March2022


      Value in Billion USD

      % Growth

      Mar-22

      Mar-21

      Mar-20

      Mar-22 over Mar-21

      Mar-22 over Mar-20

      Exports

      40.38

      35.26

      21.49

      14.53

      87.89

      Imports

      59.07

      48.90

      31.47

      20.79

      87.68

      Deficit

      18.69

      13.64

      9.98

      36.97

      87.23


      Statement 2: India’s Total Trade in Merchandise goods in Apr 2021-Mar2022


      Value in Billion USD

      % Growth

      Apr21-Mar22

      Apr20-Mar21

      Apr19-Mar20

      Apr21-Mar22 over Apr20-Mar21

      Apr21-Mar22 over Apr19-Mar20

      Exports

      417.81

      291.81

      313.36

      43.18

      33.33

      Imports

      610.22

      394.44

      474.71

      54.71

      28.55

      Deficit

      192.41

      102.63

      161.35

      87.49

      19.25


      https://static.pib.gov.in/WriteReadData/userfiles/image/image005XSBM.png

      https://static.pib.gov.in/WriteReadData/userfiles/image/image0066YRB.png

      Value of non-petroleum exports in March 2022 was 33.00 USD billion, registering a positive growth of 4.28% over non-petroleum exports of USD 31.65 billion in March 2021 and a positive growth of 73.94% over non-petroleum exports of USD 18.97 billion in March 2020.

      Value of non-petroleum imports was USD 40.66 billion in March 2022 with a positive growth of 5.26% over non-petroleum imports of USD 38.63 billion in March 2021 and a positive growth of 89.79% over non-petroleum imports of USD 21.42 billion in March 2020.

      Statement 3: Merchandise Non-POL Trade in March 2022


      Value in Billion USD

      % Growth


      Mar-22

      Mar-21

      Mar-20

      Mar-22 over Mar-21

      Mar-22 over Mar-20

      Exports

      33.00

      31.65

      18.97

      4.28

      73.94

      Imports

      40.66

      38.63

      21.42

      5.26

      89.79

      The cumulative value of non-petroleum exports in April 2021-March 2022 was USD 352.76 billion, an increase of 32.62% over USD 266.00 billion in April 2020-March 2021 and an increase of 29.66% over USD 272.07 billion in April 2019-March 2020.

      The cumulative value of non-petroleum imports in April 2021-March 2022 was USD 449.54 billion, showing an increase of 44.2% compared to non-oil imports of USD 311.75 billion in April 2020-March 2021 and an increase of 30.62% compared to non-oil imports of USD 344.16 billion in April 2019-March 2020.

      Statement 4: Merchandise Non-POL Trade Apr 2021-Mar 2022


      Value in Billion USD

      % Growth


      Apr21-Mar22

      Apr20-Mar21

      Apr19-Mar20

      Apr21-Mar22 over Apr20-Mar21

      Apr21-Mar22 over Apr19-Mar20

      Exports

      352.76

      266.00

      272.07

      32.62

      29.66

      Imports

      449.54

      311.75

      344.16

      44.20

      30.62

      Value of non-petroleum and non-gems and jewellery exports in March 2022 was USD 29.38 billion, registering a positive growth of 4.79% over non-petroleum and non-gems and jewellery exports of USD 28.03 billion in March 2021 and a positive growth of 73.28% over non-petroleum and non-gems and jewellery exports of USD 16.95 billion in March 2020.

      Value of non-oil, non-GJ (gold, silver & Precious metals) imports was USD 36.18 billion in March 2022 with a positive growth of 31.21% over non-oil and non-GJ imports of USD 27.58 billion in March 2021 and a positive growth of 93.52% over non-oil and non-GJ imports of USD 18.70 billion in March 2020.

      Statement 5: Merchandise Non-POL Non-GJ Trade in March 2022


      Value in Billion USD

      % Growth


      Mar-22

      Mar-21

      Mar-20

      Mar-22 over Mar-21

      Mar-22 over Mar-20

      Exports

      29.38

      28.03

      16.95

      4.79

      73.28

      Imports

      36.18

      27.58

      18.70

      31.21

      93.52

      The cumulative value of non-petroleum and non-gems and jewellery exports in April 2021-March 2022 was USD 313.82 billion, an increase of 30.77% over cumulative value of non-petroleum and non-gems and jewellery exports of USD 239.98 billion in April 2020-March 2021 and an increase of 32.88% over cumulative value of non-petroleum and non-gems and jewellery exports of USD 236.17 billion in April 2019-March 2020.

      Non-oil, non-GJ (Gold, Silver & Precious Metals) imports was USD 369.19 billion in April 2021-March 2022, recording a positive growth of 43.39%, as compared to non-oil and non-GJ imports of USD 257.47 billion in April 2020-March 2021 and a positive growth of 26.98% over USD 290.74 billion in April 2019-March 2020.

      Statement 6: Merchandise Non-POL Non-GJ Trade Apr 2021-Mar 2022


      Value in Billion USD

      % Growth


      Apr21-Mar22

      Apr20-Mar21

      Apr19-Mar20

      Apr21-Mar22 over Apr20-Mar21

      Apr21-Mar22

      over Apr19-Mar20

      Exports

      313.82

      239.98

      236.17

      30.77

      32.88

      Imports

      369.19

      257.47

      290.74

      43.39

      26.98

      Top 10 major commodity groups covering 81% of total exports in March 2022, are –

      Statement 7: Exports of Top 10 Major Commodity Groups in March 2022


      Value of Export (Million US$)

      Share (%)

      Growth (%)

      Major Commodity Group

      Mar-22

      Mar-21

      Mar-22

      Mar-22

      over Mar-21

      Engineering goods                                          

      10470.80

      9298.36

      25.93

      12.61

      Petroleum products                                         

      7377.07

      3609.36

      18.27

      104.39

      Gems and Jewellery                                         

      3624.34

      3613.01

      8.98

      0.31

      Organic and Inorganic chemicals                            

      2649.59

      2288.87

      6.56

      15.76

      Drugs and Pharmaceuticals                                  

      2261.65

      2295.05

      5.60

      -1.46

      Electronic goods                                           

      1740.56

      1400.67

      4.31

      24.27

      RMG of all Textiles                                        

      1661.50

      1425.95

      4.11

      16.52

      Cotton Yarn/Fabs./Madeups, Handloom products etc.          

      1290.26

      1105.05

      3.20

      16.76

      Rice                                                       

      985.48

      1116.54

      2.44

      -11.74

      Plastic and Linoleum                                       

      811.53

      719.54

      2.01

      12.78

      Total of 10 Major Commodity Groups

      32872.78

      26872.40

      81.41

      22.33

      Rest

      7506.82

      8384.20

      18.59

      -10.46

      Total Exports

      40379.59

      35256.60

      100.00

      14.53

      Top 10 major commodity groups covering 81% of total imports in March 2022, are – 

      Statement 8: Imports of Top 10 Major Commodity Groups in March 2022


      Import (Million US$)

      Share (%)

      Growth (%)

      Major Commodity Group

      Mar-22

      Mar-21

      Mar-22

      Mar-22 over

      Mar-21

      Petroleum, Crude & products

      18406.97

      10271.38

      31.16

      79.21

      Electronic goods

      8293.79

      5864.15

      14.04

      41.43

      Coal, Coke & Briquettes, etc.

      4390.95

      1735.74

      7.43

      152.97

      Machinery, electrical & non-electrical

      3457.83

      3513.68

      5.85

      -1.59

      Pearls, precious & Semi-precious stones

      3337.02

      2547.27

      5.65

      31.00

      Organic & Inorganic Chemicals

      2720.91

      2102.57

      4.61

      29.41

      Transport equipment

      1993.64

      2210.75

      3.38

      -9.82

      Artificial resins, plastic materials, etc.

      1861.93

      1719.92

      3.15

      8.26

      Vegetable Oil

      1674.59

      1076.81

      2.84

      55.51

      Fertilisers, Crude & manufactured

      1615.96

      204.16

      2.74

      691.50

      Total of 10 Major Commodity Groups

      47753.59

      31246.42

      80.85

      52.83

      Rest

      11312.37

      17652.44

      19.15

      -35.92

      Total Imports

      59065.96

      48898.86

      100.00

      20.79

      Top 10 major commodity groups covering 80% of total exports in April 2021-March 2022, are – 

      Statement 9: Exports of Top 10 Major Commodity Groups in April 2021-March 2022


      Value of Export (Million US$)

      Share (%)

      Growth (%)

      Major Commodity Group

      Apr21-Mar22

      Apr20-Mar21

      Apr21-Mar22

      Apr21-Mar22 

      over Apr20-Mar21

      Engineering goods                                          

      111632.94

      76719.60

      26.72

      45.51

      Petroleum products                                         

      65044.80

      25804.37

      15.57

      152.07

      Gems and Jewellery                                         

      38942.88

      26022.82

      9.32

      49.65

      Organic and Inorganic chemicals                            

      29152.67

      22088.48

      6.98

      31.98

      Drugs and Pharmaceuticals                                  

      24475.36

      24444.03

      5.86

      0.13

      RMG of all Textiles                                        

      15936.70

      12272.21

      3.81

      29.86

      Electronic goods                                           

      15588.06

      11093.29

      3.73

      40.52

      Cotton Yarn/Fabs./Madeups, Handloom products etc.          

      15244.20

      9827.89

      3.65

      55.11

      Plastic and Linoleum                                       

      9783.35

      7462.85

      2.34

      31.09

      Rice                                                       

      9625.50

      8829.21

      2.30

      9.02

      Total of 10 Major Commodity Groups

      335426.46

      224564.75

      80.28

      49.37

      Rest

      82382.75

      67243.73

      19.72

      22.51

      Total Exports

      417809.21

      291808.48

      100.00

      43.18

      Top 10 major commodity groups covering 77% of total imports in April 2021-March 2022, are – 

      Statement 10: Imports of Top 10 Major Commodity Groups in April 2021-March 2022


      Import (Million US$)

      Share (%)

      Growth (%)

      Major Commodity Group

      Apr21-Mar22

      Apr20-Mar21

      Apr21-Mar22

      Apr21-Mar22 over

      Apr20-Mar21

      Petroleum, Crude & products

      160683.24

      82683.87

      26.33

      94.33

      Electronic goods

      73067.90

      54287.93

      11.97

      34.59

      Gold

      46140.66

      34603.92

      7.56

      33.34

      Machinery, electrical & non-electrical

      39853.08

      30084.48

      6.53

      32.47

      Coal, Coke & Briquettes, etc.

      31514.97

      16274.53

      5.16

      93.65

      Pearls, precious & Semi-precious stones

      30927.82

      18887.96

      5.07

      63.74

      Organic & Inorganic Chemicals

      30222.86

      19825.35

      4.95

      52.45

      Transport equipment

      20206.07

      18649.18

      3.31

      8.35

      Artificial resins, plastic materials, etc.

      20104.96

      13510.01

      3.29

      48.82

      Vegetable Oil

      18931.51

      11089.11

      3.10

      70.72

      Total of 10 Major Commodity Groups

      471653.07

      299896.33

      77.29

      57.27

      Rest

      138568.35

      94539.54

      22.71

      46.57

      Total Imports

      610221.42

      394435.87

      100.00

      54.71


      Topics

      ActsIncome Tax