
Just a moment...

Top
Help
×

By creating an account you can:

Logo TaxTMI
>
Call Us / Help / Feedback

Contact Us At :

E-mail: [email protected]

Call / WhatsApp at: +91 99117 96707

For more information, Check Contact Us

FAQs :

To know Frequently Asked Questions, Check FAQs

Most Asked Video Tutorials :

For more tutorials, Check Video Tutorials

Submit Feedback/Suggestion :

Email :
Please provide your email address so we can follow up on your feedback.
Category :
Description :
Min 15 characters0/2000
Add to...
You have not created any category. Kindly create one to bookmark this item!
Create New Category
Hide
Title :
Description :
❮❮ Hide
Default View
Expand ❯❯
Close ✕
🔎 News - Adv. Search
TEXT SEARCH:

Press 'Enter' to add multiple search terms. Rules for Better Search

Search In:
Main Text + AI Text
  • Main Text
  • Main Text + AI Text
  • AI Text
Category: ?
Categorized by AI
---- All Categories ----
  • ---- All Categories ----
  • Income Tax
  • GST
  • Customs, DGFT & SEZ
  • FEMA & RBI
  • Corp. Laws, SEBI & IBC
  • PMLA, Black Money & ED
  • Budget
  • News and Press Release
  • PTI News
Month:
---- All Months ----
  • ---- All Months ----
  • January
  • February
  • March
  • April
  • May
  • June
  • July
  • August
  • September
  • October
  • November
  • December
Year:
---- All Years ----
  • ---- All Years ----
  • 2026
  • 2025
  • 2024
  • 2023
  • 2022
  • 2021
  • 2020
  • 2019
  • 2018
  • 2017
  • 2016
  • 2015
  • 2014
  • 2013
  • 2012
  • 2011
Sort By: ?
In Sort By 'Default', exact matches for text search are shown at the top, followed by the remaining results in their regular order.
RelevanceDefaultDate
    Cabinet okays new National Investment Policy to create 10 mn tons of fresh urea capacity
    India-UK trade pact 'new gold standard' of trade deals: UK High Commissioner Cameron
    World shares are mixed, oil prices climb as Iran threatens to block Middle East energy exports
    Raktsey Karpo, Halman apricots spearhead Ladakh's biggest export drive; LG pitches processing unit
    UK-India trade agreement significant milestone: Vice president
    Commerce Minister Piyush Goyal must clarify: Cong slams govt on US bill for 100-pc tariffs on India
    Tehran threatens to halt all Mideast energy exports after US reimposes its blockade on Iran
    RBI invites public comments on the draft “Reserve Bank of India (Acquisition and Holding of Shares or Voting Rights) Amendment Directions, 2026”
    PROVISIONAL ESTIMATES OF WHOLESALE PRICE INDEX, OUTPUT PRODUCER PRICE INDEX, AND TRIAL INPUT PRODUCER PRICE INDEX FOR THE MONTH OF JUNE 2026, AND FINA...
    PM hails operationalisation of India-UK CETA; says it will give fresh momentum to farmers, MSMEs
    India-UK trade pact comes into force
    Rayzon Solar Achieves NABL Accreditation for Its R&D Laboratory, Elevating Standards in Solar Manufacturing Excellence
    China's economy grew at 4.3% annual pace in 2nd quarter, slowest since late 2022
    Industry celebrates 'landmark' FTA entry into force to catalyse India-UK trade
    Stock markets rebound in early trade; Sensex jumps 553 points
    Rupee rises 5 paise to 96.11 against US dollar in early trade
    US Senators unveil bill for 100 per cent tariffs on India, four others for buying Russian oil
    PNB case: Nirav Modi's sister wants to record her statement via video conference
    Rupee falls 48 paise to close at 96.16 against US dollar
    RBI guv asks banks to leverage advanced technologies
❯❯
MaximizeMaximizeMaximize
0 / 200
Expand Note
Add to Folder

No Folders have been created

    +

    Are you sure you want to delete "My most important" ?

    NOTE:

    News
    Showing Results for :
    Reset Filters
    Results Found:
    Show All SummariesHide All Summaries
    July 15, 2026
    Show AI Summary
    Domestic urea investment policy supports new natural gas-based capacity through subsidy-cost separation, assured returns, and foreign-exchange risk mitigation.
    National Investment Policy 2026 establishes an investment framework to add domestic natural gas-based urea production capacity and reduce import reliance. Extending the New Investment Policy 2012, it provides for separation of fixed and variable costs for subsidy calculation, assured returns for urea plant companies, and foreign-exchange risk mitigation to support investment in new domestic urea manufacturing capacity.
    July 15, 2026
    Show AI Summary
    India-UK free trade agreement expands zero-duty export access and reduces duties on specified United Kingdom goods.
    The India-UK Comprehensive Economic and Trade Agreement entered into force with zero-duty market access for nearly all Indian exports to the United Kingdom. It is expected to support sectors including textiles, leather, gems and jewellery, engineering goods, marine products, chemicals and processed foods. A bilateral social security agreement has also become operational. The arrangement reduces Indian import duties on specified United Kingdom goods, including Scotch whisky and premium UK-built cars.
    July 15, 2026
    Show AI Summary
    Middle East energy export disruption risks raise oil prices and unsettle global equity markets amid renewed conflict.
    Middle East energy-export disruption risks increased following renewed conflict and a threatened halt to regional oil and gas exports amid a blockade of Iranian ports. Concerns over the security of shipping through the Strait of Hormuz contributed to higher oil prices and reduced Gulf traffic flows, reflecting the potential for wider interruption of energy transportation. Global equity markets showed mixed movements as investors assessed escalating conflict, oil-supply disruption, inflation data and corporate earnings.
    July 15, 2026
    Show AI Summary
    Apricot export facilitation enables overseas market access through exporter-managed supply chains, cold-chain transport, and proposed local processing capacity.
    Apricot export facilitation for Ladakh's indigenous Raktsey Karpo and Halman varieties is being implemented through an agreement under which exporters manage harvesting, sorting, grading, packing, transportation and marketing. Administrative measures include transport monitoring, expedited transit arrangements and cold-chain support for perishable produce. A proposed apricot processing unit is intended to improve value addition, address short shelf life and support smoother exports while reducing post-harvest losses.
    July 15, 2026
    Show AI Summary
    India-UK trade agreement expands market access, tariff reductions, services trade and professional mobility across identified commercial sectors.
    The India-UK Comprehensive Economic and Trade Agreement entered into force as a free trade arrangement intended to expand bilateral market access and promote movement of goods and services. It provides for tariff reductions and supports trade, services and professional mobility. The agreement is expected to create opportunities for businesses, entrepreneurs, farmers, manufacturers, MSMEs and skilled workers, including in textiles, leather, gems and jewellery, engineering goods, marine products, chemicals and processed foods.
    July 15, 2026
    Show AI Summary
    Punitive tariffs for Russian oil purchases could make trade duties a geopolitical mechanism targeting India and other countries.
    Proposed United States tariff legislation would impose punitive tariffs on India and other specified countries for purchasing oil from Russia. Certain European countries purchasing Russian gas would be exempted on the stated basis that their purchases are limited and that they are reducing dependence on Russia. If enacted, the measure would expressly authorise tariffs as a geopolitical mechanism directed at countries considered to be financing another nation's war effort.
    July 15, 2026
    Show AI Summary
    Strait of Hormuz transit rights remain contested as blockade measures, toll disputes, and hostilities threaten regional energy exports.
    Maritime access through the Strait of Hormuz is disputed following the reimposition of a naval blockade, retaliatory threats affecting regional energy exports, and attacks on shipping routes. An interim arrangement had provided for toll-free transit during a limited negotiating period but left the later regulatory position unresolved. One side asserts a right to regulate traffic and potentially levy transit charges, while the opposing position maintains that passage should remain open without tolls. Continuing hostilities and stalled negotiations threaten navigational access and energy trade flows.
    July 15, 2026
    Show AI Summary
    Major banking shareholding acquisitions: draft directions propose simplified approval for subsequent investments by institutional fund categories.
    Draft directions propose a simplified approval process for subsequent acquisitions of major shareholding or voting rights in banking companies by mutual funds, insurance companies and pension funds. The proposals cover commercial banks, small finance banks, payments banks and local area banks. Regulated entities, the public and other stakeholders may provide feedback through the Reserve Bank's online consultation facility or by email within the stated consultation period.
    July 15, 2026
    Show AI Summary
    Wholesale and producer price indices report rising June inflation, revisions to April estimates, and manufacturing input-price movements.
    Provisional June 2026 and final April 2026 estimates are reported for the Wholesale Price Index, Output Producer Price Index, and trial Input Producer Price Index under the base year 2022-23. Wholesale inflation increased year-on-year, driven principally by mineral oils, food articles, basic metals, and chemicals and chemical products. April WPI and Output PPI estimates were revised upward, while the April trial Input PPI was revised downward. The release also provides group-wise monthly and cumulative index data, weighted response rates for WPI estimates, and provisional and final data classifications.
    July 15, 2026
    Show AI Summary
    India-UK trade agreement operationalisation expands market access, tariff reductions, skilled mobility and social security support for enterprises and professionals.
    The India-United Kingdom Comprehensive Economic and Trade Agreement is intended to facilitate greater two-way movement of goods and services through tariff reductions and stronger access to the UK market for farmers, entrepreneurs, MSMEs and other sectors. Together with the Agreement on Social Security, it is described as promoting cooperation in technology, professional services and innovation, supporting mobility for skilled Indian talent, and assisting Indian professionals temporarily working in the UK.
    July 15, 2026
    Show AI Summary
    Zero-duty market access under the India-UK trade pact expands opportunities for domestic goods, enterprises, professionals and skilled mobility.
    The India-UK Comprehensive Economic and Trade Agreement has been operationalised, enabling a range of domestic goods to enter the UK market at zero customs duty and expanding market access for Indian farmers, entrepreneurs and micro, small and medium enterprises. A social security agreement has also entered into force to support Indian professionals temporarily working in the UK, improve enterprise competitiveness, and complement cooperation in technology, professional services, innovation and skilled-worker mobility.
    July 15, 2026
    Show AI Summary
    Accredited photovoltaic module testing strengthens reliability validation, safety qualification, and in-house product development under internationally recognised laboratory quality standards.
    NABL accreditation under ISO/IEC 17025:2017 recognises a photovoltaic module laboratory's technical competence to conduct testing through accepted procedures, calibrated equipment, qualified personnel and quality-management controls. Its scope includes module design and safety qualification, degradation testing and high-temperature operating-condition assessment. Environmental, electrical and mechanical evaluations-including thermal cycling, damp heat, humidity freeze, UV exposure, mechanical loads, leakage current, insulation and power testing-support design verification, reliability analysis, manufacturing consistency and product development.
    July 15, 2026
    Show AI Summary
    Export-led growth exposes weak domestic demand as high-technology manufacturing support raises trade imbalance and employment concerns.
    China's growth has become increasingly reliant on strong exports of high-technology manufactured products, while domestic consumption and investment remain weak. Household spending is constrained by the property-sector downturn and uncertainty over jobs and wages. Policy support and investment in artificial intelligence, robotics and advanced manufacturing have strengthened exports but raised concerns about trade imbalances, excess production capacity and employment creation. The policy direction identified is to strengthen the domestic market and maintain employment while pursuing higher-quality growth.
    July 15, 2026
    Show AI Summary
    India-UK trade agreement enables tariff reductions, market access and digital trade facilitation for expanded cross-border commerce and investment.
    India-UK Comprehensive Economic and Trade Agreement (CETA) entered into force, establishing tariff reductions, expanded market access and greater certainty for cross-border trade and investment. Its 30 chapters cover trade in goods and services, sanitary and phytosanitary measures, technical barriers to trade, digital trade, intellectual property and government procurement. Trade-facilitation and digital provisions are intended to improve cross-border commerce, while the framework supports bilateral business, investment and collaboration across services, manufacturing, technology and healthcare sectors.
    July 15, 2026
    Show AI Summary
    Equity market rebound follows softer United States inflation, supporting expectations of a less aggressive Federal Reserve policy stance.
    Indian benchmark equity indices rebounded in early trading, supported by bank and selected large-cap shares after the preceding session's decline. Softer-than-expected United States consumer inflation strengthened expectations of a less aggressive Federal Reserve monetary-policy stance and supported global risk sentiment. Stronger United States equities, generally positive Asian markets, Brent crude movements and foreign institutional investor equity sales were identified as relevant market factors.
    July 15, 2026
    Show AI Summary
    Foreign exchange market conditions lifted the rupee early, but crude prices, investor outflows and geopolitical tensions restrained gains.
    Foreign exchange market conditions supported an early appreciation of the rupee against the US dollar, while elevated crude oil prices, foreign institutional investor outflows, higher US Treasury yields and West Asia tensions limited gains. A weaker dollar and positive domestic equity-market opening provided support. Intensified US-Iran conflict and risks to regional energy exports contributed to higher crude prices and dollar demand. Higher wholesale price inflation and growth in net direct tax collection formed part of the domestic economic backdrop.
    July 15, 2026
    Show AI Summary
    Proposed geopolitical tariffs would target major purchasers of Russian oil, alongside broad sanctions on Russia's economic sectors.
    Proposed United States legislation would authorise tariffs of up to 100 per cent on India, China, Slovakia, Hungary and Azerbaijan as major purchasers of Russian oil. It also contemplates broad blocking sanctions affecting Russia's energy, financial and defence sectors and designated persons. The tariffs would be narrowly targeted and subject to restricted waiver authority, while certain European purchasers of Russian gas would be exempted based on limited dependence and efforts to reduce reliance on Russia.
    July 14, 2026
    Show AI Summary
    Video-conference statement request in PNB fraud case pending decision on approver plea, with prosecution reply sought
    Purvi Modi, an accused in the Punjab National Bank fraud case, has sought permission to record her statement before the special CBI court through video conference. She has applied to become an approver, and the CBI has stated that her statement should be recorded before that application is decided. The court has sought the prosecution's response. Purvi Modi and her husband have already become approvers in a related money-laundering investigation conducted by the Enforcement Directorate.
    July 14, 2026
    Show AI Summary
    Rupee depreciation reflects crude oil pressures, safe-haven dollar demand, widening trade deficit, and rising global economic uncertainty
    The Indian rupee depreciated against the US dollar amid higher crude oil prices, renewed geopolitical concerns, increased safe-haven demand for the dollar, and rising global bond yields. Higher crude prices increased India's dollar-denominated import requirements, widened the trade deficit, and intensified foreign-exchange outflows. Merchandise exports increased year-on-year, but the trade deficit widened because of stronger imports. Wholesale price inflation also rose, while net direct tax collections increased on account of higher corporate tax receipts.
    July 14, 2026
    Show AI Summary
    Advanced technology in banking requires cybersecurity, internal controls, fraud prevention, and safeguards against data misuse.
    Banks were encouraged to use advanced technologies, including artificial intelligence, to expand their reach, improve operational efficiency, reduce costs, and enhance customer experience. This approach must be supported by robust cybersecurity, strong internal controls, and safeguards against fraud and misuse of data. The banking sector was also urged to serve all segments of the economy prudently, strengthen customer service, and consider developments involving the Central KYC Records Registry, counterfeit currency detection, MuleHunter, central bank digital currency, the Unified Lending Interface, Account Aggregator, FX Retail, and Retail Direct.

    News

    Back

    All News

    Showing Results for :
    Reset Filters
      No Records Found

      News

      Back

      All News

      whatsappJoin Channel
      Showing Results for : Reset Filters
      News and Press Release

      PROVISIONAL ESTIMATES OF WHOLESALE PRICE INDEX, OUTPUT PRODUCER PRICE INDEX, AND TRIAL INPUT PRODUCER PRICE INDEX FOR THE MONTH OF JUNE 2026, AND FINAL ESTIMATES FOR THE MONTH OF APRIL 2026

      July 15, 2026

      Contents
      Summary
      Note

      Note

      -

      Bookmark

      Print

      Print

      Provisional Estimates of Wholesale Price Index (Base Year 2022-23) for the month of June 2026

      Key highlights of WPI (Base Year 2022-23) for June 2026

      1. All India Wholesale Price Index (WPI) inflation for June 2026 is 9.87 per cent on year-on-year (YoY) basis, compared to 9.68 per cent in May 2026. The index for All Commodities for June 2026 stands at 110.2, whereas it was 109.9 in May 2026.
      2. YoY inflation rates for major groups, namely, Primary Articles, Fuel and Power, and Manufactured Products are 7.0 per cent, 27.41 per cent, and 7.48 per cent, respectively in June 2026, compared to 4.99 per cent, 30.33 per cent, and 7.48 per cent, respectively in May 2026. The indices for Primary Articles, Fuel and Power, and Manufactured Products are 116.1, 111.1, and 107.8, respectively, in June 2026, whereas they were 113.7, 113, and 107.8, respectively, in May 2026.
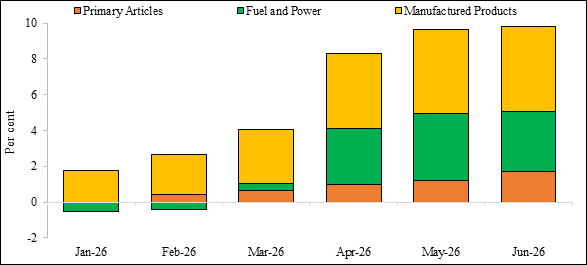
      3. Across groups, ‘Mineral Oils (containing Petroleum Products)’, ‘Food Articles’, ‘Manufacture of Basic Metals’, and ‘Manufacture of Chemicals and Chemical Products’, have been major drivers of WPI inflation in June 2026.
      4. WPI Food Index (weight=24.99 per cent): The Food Index consists of ‘Food Articles’ from Primary Articles major group, and ‘Manufacture of Food Products’ from Manufactured Products major group. It observed a YoY inflation of 6.14 per cent in June 2026, compared to 4.49 per cent in May 2026.
      5. Monthly indices and Inflation Rate (in per cent) for All commodities and Major Groups, along with major group-wise contribution for the past months are presented in the charts below.

      Chart 1: WPI Index and Inflation Rate for All Commodities
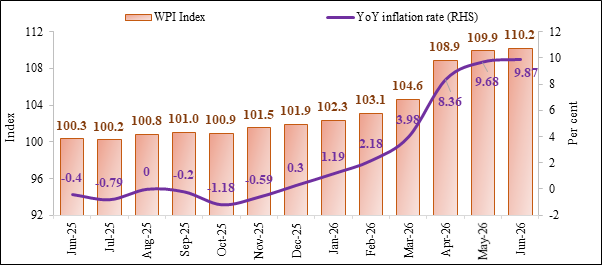
      Chart 2: WPI Index of Major Groups
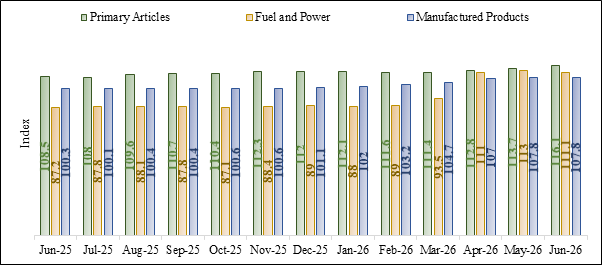
      Chart 3: Inflation Rate across Major Groups
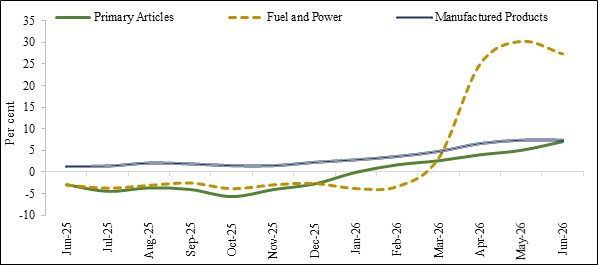
      Chart 4: Major Group-Wise contribution to Inflation
      1. The final index for the month of April 2026 has been revised from 108.8 (Provisional estimate) to 108.9. Accordingly, WPI inflation has been revised from 8.26 per cent, as per provisional estimate to 8.36 as per the final estimate.
      2. The Final Estimate of WPI (Base Year 2022-23) for the month of April 2026 has been compiled with a weighted response rate of 97.5 per cent.
      3. The Provisional Estimate of WPI (Base Year 2022-23) for the month of June 2026 has been compiled with a weighted response rate of 82.6 per cent.
      4. Wholesale Price Index and Year-on-Year (YoY) Inflation Rate for All Commodities, Major Groups, and Groups for the last six months is given at Annexure-I and II.
      5. Cumulative WPI for All Commodities, Major Groups, and Groups from April to June for FY 2023-24, FY 2024-25, FY 2025-26, and FY 2026-27 is given at Annexure-III.
      6. Cumulative YoY Inflation Rate for All Commodities, Major Groups, and Groups from April to June for FY 2024-25, FY 2025-26, and FY 2026-27 is given at Annexure- IV.
      7. Item-wise data pertaining to WPI (Base Year 2022-23) series from April 2023 to June 2026 is available at (https://eaindustry.nic.in/download_data_2223.asp).
      8. Provisional indices of WPI, OPPI, and trial IPPI for a reference month are released on the 14th of the following month (if it is a working day, else on next working day). Accordingly, release of WPI, Output PPI, and trial Input PPI for the month of July 2026 will be on Friday, 14th August 2026.

      Annexure-I

      WPI for All Commodities, Major Groups and Groups for last six months

      Groups/Major Groups

      Commodity Weight

      Jan-26
      (F)

      Feb-26
      (F)

      Mar-26
      (F)

      Apr-26
      (F)

      May-26
      (P)

      Jun-26
      (P)

      ALL COMMODITIES

      100.00000

      102.3

      103.1

      104.6

      108.9

      109.9

      110.2

      I. PRIMARY ARTICLES

      22.75730

      112.1

      111.6

      111.4

      112.8

      113.7

      116.1

      (A). Food Articles

      15.97835

      113.9

      113.1

      112.8

      114.2

      115

      117.3

      (B). Non-Food Articles

      5.52841

      107

      107.3

      107.4

      107.6

      108.4

      110.4

      (C). Minerals

      1.25054

      111.1

      112

      110.8

      118.8

      119.7

      125.1

      II. FUEL AND POWER

      14.11433

      88

      89

      93.5

      111

      113

      111.1

      (A). Coal and Lignite

      0.74136

      86.2

      86.5

      87.8

      87.7

      86.6

      87.9

      (B). Mineral Oils

      8.19208

      84.6

      85.8

      92.9

      121.6

      125.7

      122.9

      (C). Electricity

      4.46349

      94.5

      94.7

      91.2

      90.8

      90.3

      91.9

      (D). Crude Petroleum & Natural Gas

      0.71740

      88.7

      92.4

      119.7

      138.8

      136.8

      120.2

      III. MANUFACTURED PRODUCTS

      63.12837

      102

      103.2

      104.7

      107

      107.8

      107.8

      (A). Manufacture of Food Products

      9.02016

      107

      108

      109.1

      111

      112.3

      113.1

      (B). Manufacture of Beverages

      0.90483

      102.9

      102.6

      102.7

      104.4

      105.3

      105.4

      (C). Manufacture of Tobacco Products

      0.27645

      110.6

      122.7

      122.6

      122.5

      123.7

      124.3

      (D). Manufacture of Textiles

      4.08993

      93.3

      94.4

      96.4

      99.1

      101.4

      102.2

      (E). Manufacture of Wearing Apparel

      1.32948

      109.9

      109.8

      109.9

      111

      112.2

      111.9

      (F). Manufacture of Leather and Related Products

      0.54137

      104.3

      104.9

      105.5

      107.3

      108.5

      108.6

      (G). Manufacture Of Wood and Products of Wood and Cork, except Furniture; Manufacture of Articles of Straw and Plaiting Materials

      1.07718

      109.9

      110

      112.1

      115.2

      116.1

      116.9

      (H). Manufacture of Paper and Paper Products

      1.15328

      90.1

      90.6

      91.4

      93.7

      93.9

      93.8

      (I). Printing and Reproduction of Recorded Media

      0.42618

      104.8

      105.1

      105.8

      107

      108.3

      107

      (J). Manufacture of Chemicals and Chemical Products

      6.12567

      91

      91.8

      96.5

      102.6

      102.4

      102.4

      (K). Manufacture of Basic Pharmaceutical Products and Pharmaceutical Preparations 

      2.20102

      99.6

      99.6

      100.8

      102.3

      102.3

      102.2

      (L). Manufacture of Rubber and Plastic Products

      2.71467

      95.5

      96.3

      101.9

      106

      105.1

      106.2

      (M). Manufacture of Other Non-Metallic Mineral Products

      2.84074

      96.3

      96.1

      96.8

      99

      98.9

      99.6

      (N). Manufacture of Basic Metals

      8.41133

      95.2

      98

      100.1

      103.5

      104.1

      103.1

      (O). Manufacture of Fabricated Metal Products, except Machinery and Equipment

      4.13294

      100.9

      102

      102.7

      104.4

      105.8

      105.7

      (P). Manufacture of Computer, Electronic and Optical Products

      2.07628

      101.2

      101.5

      102

      101.7

      103.4

      102.7

      (Q). Manufacture of Electrical Equipment

      2.64318

      108.5

      110.2

      111

      112.7

      114.1

      114.8

      (R). Manufacture of Machinery and Equipment n.e.c.

      3.46796

      103.9

      104.3

      104.3

      105.1

      105.4

      105.4

      (S). Manufacture of Motor Vehicles, Trailers and Semi-Trailers

      5.43645

      105.9

      106.4

      105.9

      106.7

      108.5

      107.1

      (T). Manufacture of Other Transport Equipment

      1.39511

      105.1

      105.2

      105.4

      106

      106.6

      106.5

      (U). Manufacture of Furniture

      0.82618

      102

      102.6

      102.8

      105.6

      106.1

      106.4

      (V). Other Manufacturing

      2.03798

      152.4

      156.4

      158.8

      157

      158.8

      156.6

      FOOD INDEX

      24.99851

      111.4

      111.3

      111.5

      113

      114

      115.8

       (P)-Provisional, (F)-Final

        Annexure-II

      WPI Inflation Rate (YoY) for All Commodities, Major Groups, and Groups for last six months

      Groups/Major Groups

      Commodity Weight

      Jan-26
      (F)

      Feb-26
      (F)

      Mar-26
      (F)

      Apr-26
      (F)

      May-26
      (P)

      Jun-26
      (P)

      ALL COMMODITIES

      100.00000

      1.19

      2.18

      3.98

      8.36

      9.68

      9.87

      I. PRIMARY ARTICLES

      22.75730

      -0.09

      1.64

      2.58

      3.96

      4.99

      7

      (A). Food Articles

      15.97835

      -1.3

      0.8

      1.53

      2.61

      3.6

      5.49

      (B). Non-Food Articles

      5.52841

      3.98

      4.68

      6.65

      7.6

      9.49

      11.07

      (C). Minerals

      1.25054

      -0.45

      1.36

      0.09

      8

      4.91

      9.45

      II. FUEL AND POWER

      14.11433

      -3.83

      -3.37

      3.2

      25

      30.33

      27.41

      (A). Coal and Lignite

      0.74136

      -3.9

      -2.37

      -0.79

      -1.57

      -2.26

      -1.57

      (B). Mineral Oils

      8.19208

      -4.19

      -4.35

      4.26

      40.74

      49.82

      46.48

      (C). Electricity

      4.46349

      -2.28

      -1.56

      -2.04

      -2.58

      -1.85

      -0.76

      (D). Crude Petroleum & Natural Gas

      0.71740

      -9.95

      -5.33

      26.13

      56.31

      61.51

      34.75

      III. MANUFACTURED PRODUCTS

      63.12837

      2.82

      3.61

      4.8

      6.68

      7.48

      7.48

      (A). Manufacture of Food Products

      9.02016

      1.61

      2.08

      2.54

      4.72

      6.14

      7.2

      (B). Manufacture of Beverages

      0.90483

      -1.06

      -0.68

      -0.68

      0.38

      1.64

      1.44

      (C). Manufacture of Tobacco Products

      0.27645

      2.03

      12.57

      11.86

      12.08

      13.59

      14.14

      (D). Manufacture of Textiles

      4.08993

      0.97

      1.94

      4.9

      7.25

      10.22

      10.85

      (E). Manufacture of Wearing Apparel

      1.32948

      3.78

      3.39

      2.9

      3.06

      4.28

      2.57

      (F). Manufacture of Leather and Related Products

      0.54137

      2.05

      2.64

      3.23

      3.87

      4.33

      3.63

      (G). Manufacture Of Wood and Products of Wood and Cork, except Furniture; Manufacture of Articles of Straw and Plaiting Materials

      1.07718

      3.1

      3

      5.06

      8.07

      7.6

      9.05

      (H). Manufacture of Paper and Paper Products

      1.15328

      -0.88

      -0.66

      0.11

      2.18

      2.74

      3.19

      (I). Printing and Reproduction of Recorded Media

      0.42618

      1.16

      1.55

      2.12

      3.08

      4.13

      2.49

      (J). Manufacture of Chemicals and Chemical Products

      6.12567

      -0.33

      0.22

      5.7

      13

      13.4

      12.78

      (K). Manufacture of Basic Pharmaceutical Products and Pharmaceutical Preparations 

      2.20102

      0.1

      0.3

      1.1

      2.61

      3.33

      2.82

      (L). Manufacture of Rubber and Plastic Products

      2.71467

      -1.24

      -0.72

      5.38

      10.07

      9.59

      9.94

      (M). Manufacture of Other Non-Metallic Mineral Products

      2.84074

      -0.31

      -0.93

      -0.1

      1.75

      1.02

      1.84

      (N). Manufacture of Basic Metals

      8.41133

      5.19

      7.34

      8.57

      10.7

      12.3

      12.31

      (O). Manufacture of Fabricated Metal Products, except Machinery and Equipment

      4.13294

      2.54

      2.82

      3.42

      5.03

      6.22

      6.12

      (P). Manufacture of Computer, Electronic and Optical Products

      2.07628

      1.3

      0.89

      -0.58

      -1.17

      -0.19

      -1.53

      (Q). Manufacture of Electrical Equipment

      2.64318

      6.69

      7.62

      7.98

      9.21

      11.32

      11.03

      (R). Manufacture of Machinery and Equipment n.e.c.

      3.46796

      0.78

      1.26

      1.07

      1.84

      2.33

      2.13

      (S). Manufacture of Motor Vehicles, Trailers and Semi-Trailers

      5.43645

      0.38

      1.82

      0.95

      0.85

      2.17

      1.71

      (T). Manufacture of Other Transport Equipment

      1.39511

      2.34

      1.74

      1.93

      3.21

      4.31

      4

      (U). Manufacture of Furniture

      0.82618

      -0.58

      -0.1

      0.19

      3.83

      5.68

      5.03

      (V). Other Manufacturing

      2.03798

      32.52

      31.54

      32.89

      26.21

      21.87

      20.55

      FOOD INDEX

      24.99851

      -0.36

      1.27

      1.92

      3.29

      4.49

      6.14

       (P)-Provisional, (F)-Final

      Annexure-III

      Cumulative WPI for All Commodities, Major Groups, and Groups

      Groups/Major Groups

      Commodity Weight

      Apr-Jun 2023

      Apr-Jun 2024

      Apr-Jun 2025

      Apr-Jun 2026

      ALL COMMODITIES

      100.00000

      98.6

      100.3

      100.3

      109.7

      I. PRIMARY ARTICLES

      22.75730

      102.5

      110.2

      108.4

      114.2

      (A). Food Articles

      15.97835

      103.9

      114.2

      111.2

      115.5

      (B). Non-Food Articles

      5.52841

      98.9

      98

      99.5

      108.8

      (C). Minerals

      1.25054

      100.8

      113.8

      112.8

      121.2

      II. FUEL AND POWER

      14.11433

      92

      91.2

      87.6

      111.7

      (A). Coal and Lignite

      0.74136

      92.6

      89.3

      89

      87.4

      (B). Mineral Oils

      8.19208

      89.9

      90

      84.7

      123.4

      (C). Electricity

      4.46349

      95.2

      92

      92.6

      91

      (D). Crude Petroleum & Natural Gas

      0.71740

      94.3

      101.5

      87.6

      131.9

      III. MANUFACTURED PRODUCTS

      63.12837

      98.7

      98.8

      100.3

      107.5

      (A). Manufacture of Food Products

      9.02016

      98.2

      100.3

      105.8

      112.1

      (B). Manufacture of Beverages

      0.90483

      102.4

      103.7

      103.8

      105

      (C). Manufacture of Tobacco Products

      0.27645

      103.9

      106.8

      109

      123.5

      (D). Manufacture of Textiles

      4.08993

      93.6

      92.7

      92.2

      100.9

      (E). Manufacture of Wearing Apparel

      1.32948

      102.4

      104.2

      108.1

      111.7

      (F). Manufacture of Leather and Related Products

      0.54137

      101.3

      101.3

      104

      108.1

      (G). Manufacture Of Wood and Products of Wood and Cork, except Furniture; Manufacture of Articles of Straw and Plaiting Materials

      1.07718

      102

      103.1

      107.2

      116.1

      (H). Manufacture of Paper and Paper Products

      1.15328

      92.6

      89.2

      91.3

      93.8

      (I). Printing and Reproduction of Recorded Media

      0.42618

      103.1

      104.3

      104.1

      107.4

      (J). Manufacture of Chemicals and Chemical Products

      6.12567

      93.9

      91.1

      90.6

      102.5

      (K). Manufacture of Basic Pharmaceutical Products and Pharmaceutical Preparations 

      2.20102

      101

      99.4

      99.4

      102.3

      (L). Manufacture of Rubber and Plastic Products

      2.71467

      96.1

      95.4

      96.3

      105.8

      (M). Manufacture of Other Non-Metallic Mineral Products

      2.84074

      99.3

      96.5

      97.7

      99.2

      (N). Manufacture of Basic Metals

      8.41133

      96.4

      94.7

      92.7

      103.6

      (O). Manufacture of Fabricated Metal Products, except Machinery and Equipment

      4.13294

      100.4

      100.2

      99.5

      105.3

      (P). Manufacture of Computer, Electronic and Optical Products

      2.07628

      98.5

      96.5

      103.6

      102.6

      (Q). Manufacture of Electrical Equipment

      2.64318

      100.8

      101.8

      103

      113.9

      (R). Manufacture of Machinery and Equipment n.e.c.

      3.46796

      102.1

      102.2

      103.1

      105.3

      (S). Manufacture of Motor Vehicles, Trailers and Semi-Trailers

      5.43645

      103.1

      106.3

      105.8

      107.4

      (T). Manufacture of Other Transport Equipment

      1.39511

      101

      101.3

      102.4

      106.4

      (U). Manufacture of Furniture

      0.82618

      101.9

      101.6

      101.1

      106

      (V). Other Manufacturing

      2.03798

      104.7

      113

      128.2

      157.5

      FOOD INDEX

      24.99851

      101.9

      109.2

      109.2

      114.3

      Note: Cumulative Index has been calculated by taking Arithmetic Mean of 3 months indices


      Annexure-IV

       Cumulative WPI Inflation Rate (YoY) for All Commodities, Major Groups, and Groups

      Groups/Major Groups

      Weight

      Apr-Jun 2024

      Apr-Jun 2025

      Apr-Jun 2026

      All Commodities

      100.00000

      1.72

      0

      9.37

      I. Primary Articles

      22.75730

      7.51

      -1.63

      5.35

      (A). Food Articles

      15.97835

      9.91

      -2.63

      3.87

      (B). Non-Food Articles

      5.52841

      -0.91

      1.53

      9.35

      (C). Minerals

      1.25054

      12.9

      -0.88

      7.45

      II. Fuel and Power

      14.11433

      -0.87

      -3.95

      27.51

      (A). Coal and Lignite

      0.74136

      -3.56

      -0.34

      -1.8

      (B). Mineral Oils

      8.19208

      0.11

      -5.89

      45.69

      (C). Electricity

      4.46349

      -3.36

      0.65

      -1.73

      (D). Crude Petroleum & Natural Gas

      0.71740

      7.64

      -13.69

      50.57

      III. Manufactured Products

      63.12837

      0.1

      1.52

      7.18

      (A). Manufacture of Food Products

      9.02016

      2.14

      5.48

      5.95

      (B). Manufacture of Beverages

      0.90483

      1.27

      0.1

      1.16

      (C). Manufacture of Tobacco Products

      0.27645

      2.79

      2.06

      13.3

      (D). Manufacture of Textiles

      4.08993

      -0.96

      -0.54

      9.44

      (E). Manufacture of Wearing Apparel

      1.32948

      1.76

      3.74

      3.33

      (F). Manufacture of Leather and Related Products

      0.54137

      0

      2.67

      3.94

      (G). Manufacture of Wood and Products of Wood and Cork, except Furniture; Manufacture of Articles of Straw and Plaiting Materials

      1.07718

      1.08

      3.98

      8.3

      (H). Manufacture of Paper and Paper Products

      1.15328

      -3.67

      2.35

      2.74

      (I). Printing and Reproduction of Recorded Media

      0.42618

      1.16

      -0.19

      3.17

      (J). Manufacture of Chemicals and Chemical Products

      6.12567

      -2.98

      -0.55

      13.13

      (K). Manufacture of Basic Pharmaceutical Products and Pharmaceutical Preparations 

      2.20102

      -1.58

      0

      2.92

      (L). Manufacture of Rubber and Plastic Products

      2.71467

      -0.73

      0.94

      9.87

      (M). Manufacture of Other Non-Metallic Mineral Products

      2.84074

      -2.82

      1.24

      1.54

      (N). Manufacture of Basic Metals

      8.41133

      -1.76

      -2.11

      11.76

      (O). Manufacture of Fabricated Metal Products, except Machinery and Equipment

      4.13294

      -0.2

      -0.7

      5.83

      (P). Manufacture of Computer, Electronic and Optical Products

      2.07628

      -2.03

      7.36

      -0.97

      (Q). Manufacture of Electrical Equipment

      2.64318

      0.99

      1.18

      10.58

      (R). Manufacture of Machinery and Equipment n.e.c.

      3.46796

      0.1

      0.88

      2.13

      (S). Manufacture of Motor Vehicles, Trailers and Semi-Trailers

      5.43645

      3.1

      -0.47

      1.51

      (T). Manufacture of Other Transport Equipment

      1.39511

      0.3

      1.09

      3.91

      (U). Manufacture of Furniture

      0.82618

      -0.29

      -0.49

      4.85

      (V). Other Manufacturing

      2.03798

      7.93

      13.45

      22.85

      Food Index

      24.99851

      7.16

      0

      4.67

      Provisional Estimates of Output Producer Price Index (Base Year 2022-23) for the month of June 2026

      1. Key highlights of Output PPI (Base Year 2022-23) for June 2026
      1. All India Output PPI for All Commodities for June 2026 stands at 109.9, whereas it was 109.6 in May 2026.
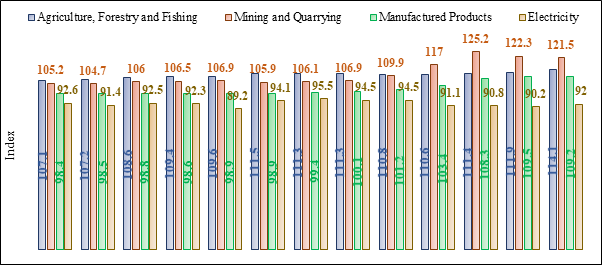
      2. WPI indices for Agriculture, Forestry and Fishing; Mining and Quarrying; Manufactured Products; and Electricity are 114.1, 121.5, 109.2, and 92.0, respectively, in June 2026, whereas they were 111.9, 122.3, 109.5, and 90.2, respectively, in May 2026.
      3. Monthly indices for All Commodities and Major Groups, for the past 13 months are presented in the charts below.

      Chart 5: Output PPI for All Commodities
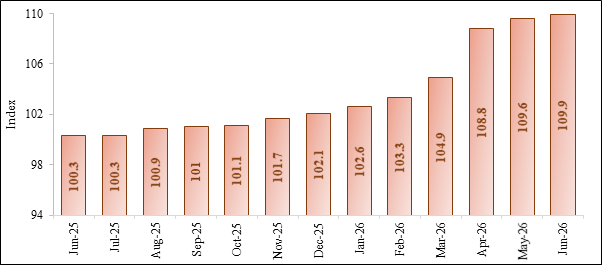
      Chart 6: Output PPI across Major Groups
      1. The final index of Output PPI for the month of April 2026 has been revised from 108.6 (Provisional estimate) to 108.8.
      2. Output PPI for All Commodities, Major Groups, and Groups for the last six months is given at Annexure-V.
      3. Cumulative Output PPI for All Commodities, Major Groups, and Groups from April to June for FY for FY 2023-24, FY 2024-25, FY 2025-26, and FY 2026-27 is given at Annexure-VI.
      4. SUT category-wise index pertaining to Output PPI (Base Year 2022-23) series from April 2023 to June 2026 is available at (https://eaindustry.nic.in/download_data_2223.asp).

      Annexure-V

      Output PPI for All Commodities, Major Groups and Groups for last six months

      Groups/Major Groups

      Weight

      Jan-26 (F)

      Feb-26 (F)

      Mar-26 (F)

      Apr-26 (F)

      May-26 (P)

      Jun-26 (P)

      ALL COMMODITIES

      100.00000

      102.6

      103.3

      104.9

      108.8

      109.6

      109.9

      AGRICULTURE, FORESTRY AND FISHING

      22.15648

      111.3

      110.8

      110.6

      111.4

      111.9

      114.1

      Crop and Animal Production, Hunting and Related Service Activities 

      19.03219

      111.7

      111.3

      111

      111.5

      111.8

      114.3

      Forestry and Logging

      1.67481

      114.4

      115

      115.4

      116.7

      117.2

      118

      Fishing and Aquaculture

      1.44948

      102.7

      99.3

      100.1

      103.2

      106.9

      106.6

      MINING AND QUARRYING

      3.42065

      106.9

      109.9

      117

      125.2

      122.3

      121.5

      Mining of Metal Ores

      0.70792

      158.6

      168

      171.5

      174.7

      174.8

      178.7

      Mining of Coal and Lignite

      0.7398

      86.2

      86.5

      87.8

      87.7

      86.6

      87.9

      Other Mining and Quarrying

      1.23208

      103.2

      103.2

      100.5

      109.9

      105.2

      113.1

      Extraction of Crude Petroleum and Natural Gas

      0.74085

      84.5

      88.9

      121.7

      141

      136.2

      114.2

      MANUFACTURED PRODUCTS

      69.93568

      100.1

      101.2

      103.4

      108.3

      109.5

      109.2

      (A). Manufacture of Food Products

      8.47196

      107.5

      108.3

      109.2

      111

      112.2

      113.2

      (B). Manufacture of Beverages

      0.8417

      103.1

      102.7

      102.8

      104.6

      105.5

      105.5

      (C). Manufacture of Tobacco Products

      0.25705

      111.9

      125.9

      125.9

      125.4

      126.7

      127.4

      (D). Manufacture of Textiles

      4.38774

      93.7

      95

      97.8

      100.9

      103.1

      104.3

      (E). Manufacture of Wearing Apparel

      1.20494

      108.8

      108.7

      108.7

      109.9

      111.2

      110.8

      (F). Manufacture of Leather and Related Products

      0.49989

      103.1

      103.6

      104.2

      105.9

      107.2

      107.3

      (G). Manufacture of Wood and Products of Wood and Cork, except Furniture; Manufacture of Articles of Straw and Plaiting Materials

      1.08949

      108.1

      108.3

      110.3

      113.3

      114.4

      114.8

      (H). Manufacture of Paper and Paper Products

      1.03128

      90.3

      90.7

      91.6

      93.9

      94.1

      94.1

      (I). Printing and Reproduction of Recorded Media

      0.30931

      105.6

      106.1

      107.1

      109.3

      109.4

      109.6

      (J). Manufacture of Coke and Refined Petroleum Products

      7.14818

      84.5

      85.7

      92.7

      121.1

      125.1

      122.3

      (K). Manufacture of Chemicals and Chemical Products

      5.74793

      91.5

      92.2

      97.3

      103.3

      102.7

      103

      (L). Manufacture of Basic Pharmaceuticals, Medicinal Chemical and Botanical Products

      1.92807

      100.7

      100.6

      101.8

      103.2

      103.1

      103

      (M). Manufacture of Rubber and Plastic Products

      2.57252

      95.9

      96.9

      102.5

      106.7

      105.7

      106.8

      (N). Manufacture of Other Non-Metallic Mineral Products

      2.50437

      96

      95.8

      96.4

      99

      98.7

      99.5

      (O). Manufacture of Basic Metals

      7.465

      94.3

      96.6

      99

      102.7

      103.9

      102.7

      (P). Manufacture of Fabricated Metal Products, except Machinery and Equipment

      3.15198

      99.3

      100.4

      101.1

      102.3

      103.6

      104

      (Q). Manufacture of Computer, Electronic and Optical Products

      1.7748

      104.4

      104.6

      104.6

      104.3

      106

      104.7

      (R). Manufacture of Electrical Equipment

      3.81453

      103.1

      104

      104.4

      105.7

      107.1

      107.9

      (S). Manufacture of Machinery and Equipment n.e.c.

      2.46158

      104.1

      104.7

      104.8

      105.7

      105.7

      105.6

      (T). Manufacture of Motor Vehicles, Trailers and Semi-Trailers

      4.39321

      106.4

      106.9

      106.6

      107.4

      108.8

      107.6

      (U). Manufacture of Other Transport Equipment

      1.34392

      106

      106.1

      106.4

      107.2

      107.5

      107.6

      (V). Manufacture of Furniture

      0.73566

      102.9

      103.2

      103.7

      105.3

      105.2

      105.4

      (W). Other Manufacturing

      6.80057

      115.9

      118.3

      119.9

      120.9

      122

      121

      ELECTRICITY

      4.48719

      94.5

      94.5

      91.1

      90.8

      90.2

      92

      Electricity

      4.48719

      94.5

      94.5

      91.1

      90.8

      90.2

      92

        (P)-Provisional, (F)-Final

      Annexure-VI

      Cumulative Output PPI for All Commodities, Major Groups and Groups

      Groups/Major Groups

      Weight

      Apr-Jun 2023-24

      Apr-Jun 2024-25

      Apr-Jun 2025-26

      Apr-Jun 2026-27

      ALL COMMODITIES

      100.00000

      98.6

      100.1

      100.3

      109.4

      AGRICULTURE, FORESTRY AND FISHING

      22.15648

      102.8

      108.6

      107.2

      112.5

      Crop and Animal Production, Hunting and Related Service Activities 

      19.03219

      102.7

      108.7

      106.9

      112.5

      Forestry and Logging

      1.67481

      102.5

      112.7

      115.1

      117.3

      Fishing and Aquaculture

      1.44948

      104.5

      102.2

      101.6

      105.6

      MINING AND QUARRYING

      3.42065

      97.1

      105.6

      103.5

      123

      Mining of Metal Ores

      0.70792

      107

      126.3

      141.8

      176.1

      Mining of Coal and Lignite

      0.7398

      92.6

      89.3

      89

      87.4

      Other Mining and Quarrying

      1.23208

      98.4

      107.9

      102.9

      109.4

      Extraction of Crude Petroleum and Natural Gas

      0.74085

      89.9

      98.2

      82.6

      130.5

      MANUFACTURED PRODUCTS

      69.93568

      97.6

      97.6

      98.5

      109

      (A). Manufacture of Food Products

      8.47196

      97.1

      99.5

      105.7

      112.1

      (B). Manufacture of Beverages

      0.8417

      102.5

      103.9

      104

      105.2

      (C). Manufacture of Tobacco Products

      0.25705

      103.8

      106.8

      109.3

      126.5

      (D). Manufacture of Textiles

      4.38774

      93.7

      93

      92.4

      102.8

      (E). Manufacture of Wearing Apparel

      1.20494

      101.9

      103.3

      107.3

      110.6

      (F). Manufacture of Leather and Related Products

      0.49989

      100.8

      100.3

      102.6

      106.8

      (G). Manufacture of Wood and Products of Wood and Cork, except Furniture; Manufacture of Articles of Straw and Plaiting Materials

      1.08949

      102

      102.6

      106.1

      114.2

      (H). Manufacture of Paper and Paper Products

      1.03128

      92.6

      89.3

      91.5

      94

      (I). Printing and Reproduction of Recorded Media

      0.30931

      103.8

      105

      105.3

      109.4

      (J). Manufacture of Coke and Refined Petroleum Products

      7.14818

      90

      90

      84.7

      122.8

      (K). Manufacture of Chemicals and Chemical Products

      5.74793

      94.1

      91.2

      91.1

      103

      (L). Manufacture of Basic Pharmaceuticals, Medicinal Chemical and Botanical Products

      1.92807

      101.7

      99.2

      99.4

      103.1

      (M). Manufacture of Rubber and Plastic Products

      2.57252

      96.2

      95.5

      96.3

      106.4

      (N). Manufacture of Other Non-Metallic Mineral Products

      2.50437

      99.1

      96.2

      97.1

      99.1

      (O). Manufacture of Basic Metals

      7.465

      96.2

      94.6

      92

      103.1

      (P). Manufacture of Fabricated Metal Products, except Machinery and Equipment

      3.15198

      99.5

      99.5

      98.4

      103.3

      (Q). Manufacture of Computer, Electronic and Optical Products

      1.7748

      98.4

      95.7

      107.1

      105

      (R). Manufacture of Electrical Equipment

      3.81453

      99.8

      99.3

      100.6

      106.9

      (S). Manufacture of Machinery and Equipment n.e.c.

      2.46158

      102.2

      102.7

      103.2

      105.7

      (T). Manufacture of Motor Vehicles, Trailers and Semi-Trailers

      4.39321

      103.3

      106.5

      106

      107.9

      (U). Manufacture of Other Transport Equipment

      1.34392

      101.4

      101.6

      103.4

      107.4

      (V). Manufacture of Furniture

      0.73566

      101.9

      101.4

      101.5

      105.3

      (W). Other Manufacturing

      6.80057

      101.6

      103.1

      108.1

      121.3

      ELECTRICITY

      4.48719

      95.2

      92

      92.6

      91

      Electricity

      4.48719

      95.2

      92

      92.6

      91

      Note: Cumulative Index has been calculated by taking Arithmetic Mean of 3 months indices

      Provisional Estimates of Trial Input Producer Price Index (IPPI) (Base Year 2022-23) for the month of June 2026

      1. All India trial Input PPI for Manufacturing Sector for June 2026 stands at 107.1 (Provisional estimate).
      2. Trial Input PPI for Manufacturing Sector for the month of April 2026 has been revised from 104.9 (provisional estimate) to 104.2 (final estimate).
      3. Trial Input PPI for all Manufacturing Industries at NIC-2-digit, for the months of March, April May, and June 2026 is given below.

      Trial Input PPI for all Manufacturing Industries at NIC-2-digit

      Industry Group

      Weight

      Mar-26
      (F)

      Apr-26
      (F)

      May-26
      (P)

      Jun-26
      (P)

      Manufacturing Sector

      100.00000

      100.9

      104.2

      104.9

      107.1

      (A). Manufacture of Food Products

      14.84638

      107.1

      108.3

      110.5

      112.2

      (B). Manufacture of Beverages

      1.03035

      106

      104.5

      104.8

      105.5

      (C). Manufacture of Tobacco Products

      0.26443

      128

      124.7

      125.7

      123.4

      (D). Manufacture of Textiles

      5.88918

      95.5

      100.8

      103.1

      107.8

      (E). Manufacture of Wearing Apparel

      1.57012

      105.6

      106.6

      108.3

      109.6

      (F). Manufacture of Leather and Related Products

      0.77634

      96.3

      96

      96.2

      96

      (G). Manufacture of Wood and Products of Wood and Cork, Except Furniture; Manufacture of Articles of Straw and Plaiting Materials

      1.82194

      99.7

      110.8

      110.8

      112.3

      (H). Manufacture of Paper and Paper Products

      0.87494

      95.1

      96.8

      97.1

      97

      (I). Printing and Reproduction of Recorded Media

      0.46606

      96.4

      98.3

      101.2

      98.5

      (J). Manufacture of Coke and Refined Petroleum Products

      12.3291

      98.2

      105.2

      105.8

      113.5

      (K). Manufacture of Chemicals and Chemical Products

      7.98919

      100.9

      107.9

      111.8

      112.5

      (L). Manufacture of Basic Pharmaceutical Products and Pharmaceutical Preparations 

      2.40463

      98.2

      103.5

      104.9

      105.6

      (M). Manufacture of Rubber and Plastic Products

      3.40235

      105.9

      109.8

      111.9

      112.1

      (N). Manufacture of Other Non-Metallic Mineral Products

      3.28306

      92.3

      96.4

      93.2

      92.6

      (O). Manufacture of Basic Metals

      11.25229

      98.3

      100.6

      98.5

      99.2

      (P). Manufacture of Fabricated Metal Products, except Machinery and Equipment

      5.59239

      99.7

      102.2

      103.9

      105.4

      (Q). Manufacture of Computer, Electronic and Optical Products

      2.22964

      108

      108.2

      108.4

      111.5

      (R). Manufacture of Electrical Equipment

      3.64437

      111.5

      113.4

      115.8

      117.7

      (S). Manufacture of Machinery and Equipment n.e.c.

      5.07784

      102.2

      105

      102.7

      105.3

      (T). Manufacture of Motor Vehicles, Trailers and Semi-Trailers, and Manufacture of Other Transport Equipment

      10.49446

      101.5

      102.8

      104.1

      104.9

      (U). Manufacture of Furniture

      0.98353

      97.6

      101.1

      101.6

      98.6

      (V). Other Manufacturing

      3.77741

      88.9

      88.4

      83.1

      88

       (P)-Provisional, (F)-Final

      Topics

      ActsIncome Tax

