
Just a moment...

Top
Help
×

By creating an account you can:

Logo TaxTMI
>
Call Us / Help / Feedback

Contact Us At :

E-mail: [email protected]

Call / WhatsApp at: +91 99117 96707

For more information, Check Contact Us

FAQs :

To know Frequently Asked Questions, Check FAQs

Most Asked Video Tutorials :

For more tutorials, Check Video Tutorials

Submit Feedback/Suggestion :

Email :
Please provide your email address so we can follow up on your feedback.
Category :
Description :
Min 15 characters0/2000
Add to...
You have not created any category. Kindly create one to bookmark this item!
Create New Category
Hide
Title :
Description :
❮❮ Hide
Default View
Expand ❯❯
Close ✕
🔎 News - Adv. Search
TEXT SEARCH:

Press 'Enter' to add multiple search terms. Rules for Better Search

Search In:
Main Text + AI Text
  • Main Text
  • Main Text + AI Text
  • AI Text
Category: ?
Categorized by AI
---- All Categories ----
  • ---- All Categories ----
  • Income Tax
  • GST
  • Customs, DGFT & SEZ
  • FEMA & RBI
  • Corp. Laws, SEBI & IBC
  • PMLA, Black Money & ED
  • Budget
  • News and Press Release
  • PTI News
Month:
---- All Months ----
  • ---- All Months ----
  • January
  • February
  • March
  • April
  • May
  • June
  • July
  • August
  • September
  • October
  • November
  • December
Year:
---- All Years ----
  • ---- All Years ----
  • 2026
  • 2025
  • 2024
  • 2023
  • 2022
  • 2021
  • 2020
  • 2019
  • 2018
  • 2017
  • 2016
  • 2015
  • 2014
  • 2013
  • 2012
  • 2011
Sort By: ?
In Sort By 'Default', exact matches for text search are shown at the top, followed by the remaining results in their regular order.
RelevanceDefaultDate
    Goods worth USD 140 mn exported on first day of India-UK trade pact coming into effect
    CETA: Export consignment flagged from Bengaluru to UK
    India-EU TTC meet: Goyal says work program on FDI screening concluded
    India logs USD 2.8 bn current account surplus in April-May: RBI data
    Cong leader Baghel alleges BJP links to Mahadev betting app after Ebix Group chairman's arrest
    ED attaches Rs 158-crore assets of Delhi hospital in PMLA probe
    Mahadev app case: Chhattisgarh court sends Ebix chairman Vikas Garg to 10-day ED custody
    Bengal seeks to leverage India-UK CETA, eyes export boost for labour-intensive sectors
    Kolkata flags off first jewellery exports to UK under CETA
    UK-India trade pact comes into force; Envoy Cameron hails it as 'gold standard'
    RBI issues draft ‘Guidance on Regulatory Expectations for Data Governance’
    Govt unveils Rs 1.9 lakh cr semiconductor, mobile manufacturing push
    India-UK trade pact takes effect as Modi says deal will deepen economic ties and boost exports
    Cabinet approves two multitracking projects covering Four Districts across Odisha and Jharkhand, increasing the existing network of Indian Railways by...
    Cabinet approves National Investment Policy for Urea-2026 for Atmanirbhar Bharat (NIPU-2026)
    Cabinet approves development of 6 lane Greenfield Elevated Corridor & Ramps/Loops & Foot Over Bridge between National Highway-19 and Varanasi Ring Roa...
    Cabinet approves development of 6/4 lane Elevated Corridor along Varuna River Bank & its Ramps/Loops in Uttar Pradesh on Hybrid Annuity Model at total...
    Bajaj Finance Launches Loan Fest with Exclusive Rewards on Personal Loan Disbursal
    China's GDP growth slows sharply in second quarter, misses target
    Cabinet approves Rs 62,500 crore for Mobile Phone Manufacturing Scheme
❯❯
MaximizeMaximizeMaximize
0 / 200
Expand Note
Add to Folder

No Folders have been created

    +

    Are you sure you want to delete "My most important" ?

    NOTE:

    News
    Showing Results for :
    Reset Filters
    Results Found:
    Show All SummariesHide All Summaries
    July 15, 2026
    Show AI Summary
    Duty-free market access under the India-UK trade pact expands exports while preserving safeguards for procurement and policy space.
    The India-UK Comprehensive Economic and Trade Agreement provides duty-free access for nearly 99 per cent of Indian exports and includes reciprocal government-procurement access subject to safeguards. India retains MSME preferences, limits covered procurement to selected central entities, excludes strategic sectors, and applies minimum contract thresholds. The agreement preserves compulsory licensing and permits withdrawal of certain concessions if a future UK carbon tax adversely affects Indian exports. Its gender, SME, environment, and labour chapters contain no dispute-settlement provisions.
    July 15, 2026
    Show AI Summary
    India-UK trade agreement expands duty-free market access and tariff reductions for exports, services, manufacturing and small enterprises.
    India-UK Comprehensive Economic and Trade Agreement (CETA) is stated to provide duty-free access in the UK market for 99 per cent of Indian products and to reduce or eliminate UK import tariffs across key product categories. It is expected to support Karnataka exports in manufacturing, agricultural produce, processed food, electronics, aerospace and medical devices, with certain tariff reductions phased out over time. Mode 1 services provisions are identified as beneficial to Bengaluru's IT industry, while awareness programmes and investment roadshows are proposed to help exporters and attract investment.
    July 15, 2026
    Show AI Summary
    Foreign investment screening cooperation advances investment flows alongside trade, technology, supply-chain resilience and prospective investment-protection commitments.
    India and the European Union concluded a work programme on foreign direct investment screening, exchanging best practices to facilitate investment flows. Trade and Technology Council cooperation addresses market access, standards harmonisation, supply-chain requirements, deep-tech innovation and critical dependencies. The parties also discussed free trade agreement ratification, World Trade Organization reform, and prospective investment-protection and geographical-indications agreements. The Council provides an institutional mechanism for cooperation on trade, trusted technology and economic security.
    July 15, 2026
    Show AI Summary
    Balance of payments reporting shows a current account surplus despite a wider trade deficit and portfolio investment outflows.
    Balance of payments data for April-May 2026 records a current account surplus, supported by increased net services receipts, higher inward remittances and a marginal reduction in net income outgo. The merchandise trade deficit widened as imports rose more than exports. The overall balance of payments moved into deficit, while net foreign direct investment increased and net foreign portfolio investment recorded a larger net outflow.
    July 15, 2026
    Show AI Summary
    Online betting money laundering investigation examines alleged proxy accounts, simulated salary payments, cross-border routing, and custodial investigation of the money trail.
    Money-laundering allegations concerning an online betting syndicate involve purported routing of betting proceeds through fictitious or proxy bank accounts, simulated salary payments, share-capital investments, and foreign institutional channels. An Ebix Group chairman was arrested in connection with the alleged money trail and remanded for investigation. The investigating agency states that prosecution complaints have been filed and that separate state economic-offence and central investigations address connected cases. Political-link allegations were denied, and the stated laundering assertions remain under investigation.
    July 15, 2026
    Show AI Summary
    Money laundering asset attachment addresses alleged fund diversion through false invoices, inflated construction costs, shell entities and accommodation entries.
    Provisional attachment under the Prevention of Money Laundering Act was undertaken in an alleged financial-fraud investigation involving a hospital company. The allegations concern diversion of company funds through purportedly false medical-implant invoices and inflated hospital-construction costs routed through a related company. Accommodation-entry operators and shell entities were allegedly used to conceal the origin of illicit funds. The proceeding arose from a Serious Fraud Investigation Office chargesheet against the hospital promoters.
    July 15, 2026
    Show AI Summary
    Money-laundering investigation into online betting proceeds leads to custodial remand amid allegations of layered fund routing.
    A special PMLA court remanded Ebix Group chairman Vikas Garg to Enforcement Directorate custody in an investigation into alleged money laundering linked to online betting operations. The agency alleged that betting proceeds were routed through accommodation entries, shell entities and layered transactions into entities owned or controlled by Garg, and were used to acquire shares, securities and other assets. It also alleged dissipation or encumbrance of Ebix shares and an attempt to mortgage or sell property treated as proceeds of crime.
    July 15, 2026
    Show AI Summary
    India-UK CETA tariff elimination strengthens export prospects for labour-intensive leather, jute, jewellery and agricultural products in British markets.
    India-UK CETA tariff concessions are expected to improve West Bengal's export competitiveness in the United Kingdom. Duty-free access applies to tea, mangoes and betel leaves, while import duties on jewellery have been removed. Labour-intensive leather, jute, and gems and jewellery sectors are identified as principal beneficiaries, with tariff removal also improving seafood export prospects. Further competitiveness measures are proposed to help exporters use the agreement's trade opportunities.
    July 15, 2026
    Show AI Summary
    Zero-duty market access under CETA enables Indian jewellery exporters to enter overseas markets without import tariffs.
    Zero-duty access under the India-UK Comprehensive Economic and Trade Agreement enables eligible Indian gem and jewellery exports to enter the United Kingdom market without UK import tariffs. The agreement is expected to improve market access and support value-added manufacturing, employment, skill development, and the participation of artisans, micro, small and medium enterprises, and exporters in West Bengal's gem and jewellery sector.
    July 15, 2026
    Show AI Summary
    UK-India trade agreement introduces wider market access, tariff reductions and social security arrangements to support bilateral commerce.
    The UK-India Comprehensive Economic and Trade Agreement has entered into force, providing expanded market access, tariff reduction and trade facilitation. India receives zero-duty access for nearly all exports to the UK, while UK products entering India receive duty-free or reduced-tariff treatment. The framework covers goods including textiles, leather, engineering products, food, cosmetics, alcoholic beverages and premium cars. A bilateral social security agreement has also been operationalised to support wider commercial engagement.
    July 15, 2026
    Show AI Summary
    Data governance expectations propose stronger lifecycle controls, quality standards, accountability and third-party data-sharing safeguards for regulated financial entities.
    Draft regulatory guidance on data governance proposes expectations for regulated financial entities to maintain data that is accurate, consistent, secure and fit for purpose. The framework addresses data-governance arrangements, defined roles, data architecture, metadata and data lineage, data quality, and third-party data-sharing arrangements. It applies to specified banking entities, financial institutions, non-banking financial companies, asset reconstruction companies and credit information companies, and invites stakeholder feedback on the proposed framework.
    July 15, 2026
    Show AI Summary
    Semiconductor and mobile manufacturing incentives support domestic production, component sourcing, design investment, exports and resilient electronics supply chains.
    Semicon 2.0 and the Mobile Phone Manufacturing Scheme provide manufacturing support to expand domestic electronics production, exports and local value addition. Semicon 2.0 covers chip design, equipment and materials, fabrication, advanced packaging and testing, research, and talent development, while supporting semiconductor intellectual property and critical-component manufacturing. The mobile-phone scheme provides production-linked incentives linked to eligible sales, with additional support for domestic component sourcing and Indian investment in product design and research. The measures seek to reduce import dependence and strengthen domestic critical-technology capabilities.
    July 15, 2026
    Show AI Summary
    India-UK trade liberalisation expands tariff preferences, services access and skilled professional mobility while preserving protections for sensitive domestic sectors.
    The India-United Kingdom Comprehensive Economic and Trade Agreement establishes preferential tariff treatment for goods and expands cooperation in services, digital trade, government procurement, investment and professional mobility. India retains protections for sensitive sectors through phased tariff reductions and quota-based access, while duties on British automobiles and alcoholic beverages are reduced in stages. The accompanying social-security convention exempts eligible Indian professionals temporarily assigned to the United Kingdom from simultaneous contributions in both jurisdictions, supporting skilled-worker mobility and reducing employment-related costs.
    July 15, 2026
    Show AI Summary
    Railway capacity augmentation strengthens multimodal connectivity, freight movement, operational reliability and lower-emission transport across Odisha and Jharkhand.
    Railway capacity augmentation is approved through doubling of the Paradeep-Haridaspur route and construction of a fourth line on the Rajkharsawan-Dangoaposi route. The projects aim to reduce congestion, improve railway operational efficiency and reliability, and strengthen integrated multimodal connectivity. Enhanced capacity is intended to support freight transport of coal, iron ore, dolomite, limestone and gypsum, improve regional and tourist connectivity, promote logistics efficiency, and reduce oil imports and carbon emissions.
    July 15, 2026
    Show AI Summary
    Urea investment policy promotes gas-based domestic manufacturing through transparent cost treatment, return-on-equity parameters, and foreign-exchange risk mitigation.
    NIPU-2026 provides a framework for investment in new gas-based urea manufacturing units to increase indigenous production and reduce reliance on imported urea. It separates fixed and variable costs for transparency, provides a prescribed return-on-equity band, and mitigates foreign-exchange exposure through conversion of fixed costs into Indian rupees after four years at prevailing exchange rates. The policy supports self-sufficiency through additional domestic urea manufacturing capacity.
    July 15, 2026
    Show AI Summary
    Greenfield elevated corridor development strengthens multimodal connectivity, urban decongestion, road safety and pilgrimage access through the Hybrid Annuity Model.
    Development of a six-lane greenfield elevated connector corridor between National Highway-19 and the Varanasi Ring Road has been approved under the National Highways (Original) programme through the Hybrid Annuity Model. The access-controlled corridor includes elevated road infrastructure, bridges, loops, ramps, link roads and service roads, and is intended to divert through traffic from congested urban roads. Aligned with the PM Gati Shakti National Master Plan, it integrates road, rail, air and inland-water connectivity while improving access to logistics, religious, educational and cultural destinations.
    July 15, 2026
    Show AI Summary
    Hybrid annuity corridor development advances urban decongestion, multimodal connectivity, safer travel and efficient passenger and freight movement.
    A predominantly elevated 6/4-lane link and connector corridor along the Varuna River Bank has been approved under the Hybrid Annuity Model. Comprising carriageways, flyovers, loops, ramps and service roads, it will connect NH-31 with the Varanasi Ring Road under the Varanasi Decongestion Plan. The corridor is intended to reduce congestion and travel time, improve safety and freight movement, and strengthen access to transport, economic, social and logistics nodes through multimodal integration.
    July 15, 2026
    Show AI Summary
    Personal loan disbursal incentives provide eligible borrowers reward bundles, subject to eligibility conditions, verification, assessment and applicable terms.
    Personal loan disbursal incentive campaign offers eligible borrowers an entertainment and lifestyle voucher bundle upon successful disbursal during the specified promotional period. Reward availability is conditional on customer eligibility and applicable terms and conditions. The collateral-free, digitally processed credit facility involves eligibility-based approval, review of loan terms, KYC and bank-account verification, and application assessment before disbursal.
    July 15, 2026
    Show AI Summary
    Domestic-demand weakness slows China's economic growth despite export support from artificial-intelligence technology and electric-vehicle demand.
    China's economic growth slowed in the second quarter amid weak domestic demand, property-market weakness, subdued consumer confidence and higher energy costs. Export demand, especially for artificial-intelligence technology and electric vehicles, supported foreign trade and industrial production, but underscored reliance on overseas demand. Property investment and new-home prices continued to decline, while youth unemployment remained elevated. Further support measures focused on new infrastructure could be considered as investment growth weakens and systemic risks require management.
    July 15, 2026
    Show AI Summary
    Mobile phone manufacturing incentives link eligible sales, domestic sourcing, design and research support to indigenous brands and expanded production.
    The Mobile Phone Manufacturing Scheme establishes a five-year incentive-linked framework for manufacturing mobile phones in India. It provides differentiated incentive support on eligible sales, additional support for domestic sourcing of key components and sub-assemblies, and a further incentive for product design and research and development aimed at building Indian brands. The scheme seeks to expand domestic production and exports, promote technological sovereignty, create patents, support employment, and strengthen domestic value capture in mobile-phone manufacturing.

    News

    Back

    All News

    Showing Results for :
    Reset Filters
      No Records Found

      News

      Back

      All News

      whatsappJoin Channel
      Showing Results for : Reset Filters
      News and Press Release

      PROVISIONAL ESTIMATES OF WHOLESALE PRICE INDEX, OUTPUT PRODUCER PRICE INDEX, AND TRIAL INPUT PRODUCER PRICE INDEX FOR THE MONTH OF JUNE 2026, AND FINAL ESTIMATES FOR THE MONTH OF APRIL 2026

      July 15, 2026

      Contents
      Summary
      Note

      Note

      -

      Bookmark

      Print

      Print

      Provisional Estimates of Wholesale Price Index (Base Year 2022-23) for the month of June 2026

      Key highlights of WPI (Base Year 2022-23) for June 2026

      1. All India Wholesale Price Index (WPI) inflation for June 2026 is 9.87 per cent on year-on-year (YoY) basis, compared to 9.68 per cent in May 2026. The index for All Commodities for June 2026 stands at 110.2, whereas it was 109.9 in May 2026.
      2. YoY inflation rates for major groups, namely, Primary Articles, Fuel and Power, and Manufactured Products are 7.0 per cent, 27.41 per cent, and 7.48 per cent, respectively in June 2026, compared to 4.99 per cent, 30.33 per cent, and 7.48 per cent, respectively in May 2026. The indices for Primary Articles, Fuel and Power, and Manufactured Products are 116.1, 111.1, and 107.8, respectively, in June 2026, whereas they were 113.7, 113, and 107.8, respectively, in May 2026.
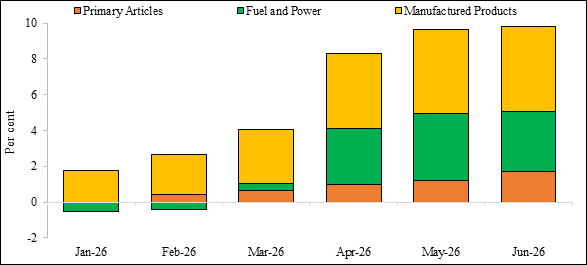
      3. Across groups, ‘Mineral Oils (containing Petroleum Products)’, ‘Food Articles’, ‘Manufacture of Basic Metals’, and ‘Manufacture of Chemicals and Chemical Products’, have been major drivers of WPI inflation in June 2026.
      4. WPI Food Index (weight=24.99 per cent): The Food Index consists of ‘Food Articles’ from Primary Articles major group, and ‘Manufacture of Food Products’ from Manufactured Products major group. It observed a YoY inflation of 6.14 per cent in June 2026, compared to 4.49 per cent in May 2026.
      5. Monthly indices and Inflation Rate (in per cent) for All commodities and Major Groups, along with major group-wise contribution for the past months are presented in the charts below.

      Chart 1: WPI Index and Inflation Rate for All Commodities
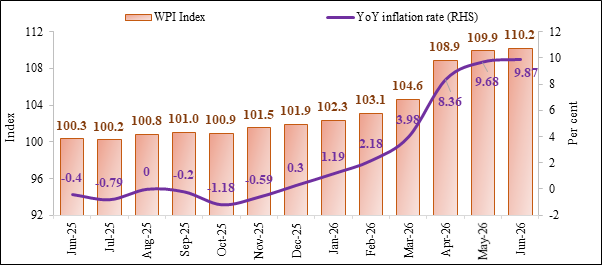
      Chart 2: WPI Index of Major Groups
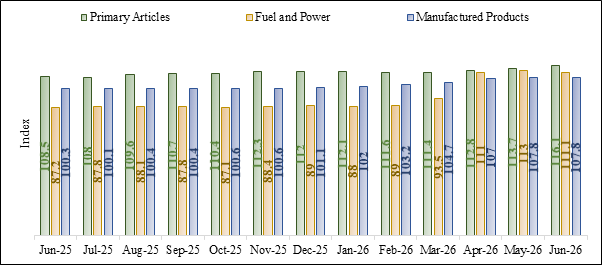
      Chart 3: Inflation Rate across Major Groups
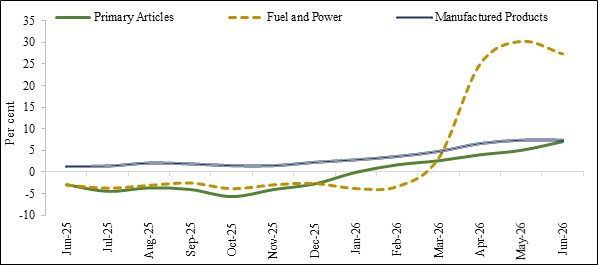
      Chart 4: Major Group-Wise contribution to Inflation
      1. The final index for the month of April 2026 has been revised from 108.8 (Provisional estimate) to 108.9. Accordingly, WPI inflation has been revised from 8.26 per cent, as per provisional estimate to 8.36 as per the final estimate.
      2. The Final Estimate of WPI (Base Year 2022-23) for the month of April 2026 has been compiled with a weighted response rate of 97.5 per cent.
      3. The Provisional Estimate of WPI (Base Year 2022-23) for the month of June 2026 has been compiled with a weighted response rate of 82.6 per cent.
      4. Wholesale Price Index and Year-on-Year (YoY) Inflation Rate for All Commodities, Major Groups, and Groups for the last six months is given at Annexure-I and II.
      5. Cumulative WPI for All Commodities, Major Groups, and Groups from April to June for FY 2023-24, FY 2024-25, FY 2025-26, and FY 2026-27 is given at Annexure-III.
      6. Cumulative YoY Inflation Rate for All Commodities, Major Groups, and Groups from April to June for FY 2024-25, FY 2025-26, and FY 2026-27 is given at Annexure- IV.
      7. Item-wise data pertaining to WPI (Base Year 2022-23) series from April 2023 to June 2026 is available at (https://eaindustry.nic.in/download_data_2223.asp).
      8. Provisional indices of WPI, OPPI, and trial IPPI for a reference month are released on the 14th of the following month (if it is a working day, else on next working day). Accordingly, release of WPI, Output PPI, and trial Input PPI for the month of July 2026 will be on Friday, 14th August 2026.

      Annexure-I

      WPI for All Commodities, Major Groups and Groups for last six months

      Groups/Major Groups

      Commodity Weight

      Jan-26
      (F)

      Feb-26
      (F)

      Mar-26
      (F)

      Apr-26
      (F)

      May-26
      (P)

      Jun-26
      (P)

      ALL COMMODITIES

      100.00000

      102.3

      103.1

      104.6

      108.9

      109.9

      110.2

      I. PRIMARY ARTICLES

      22.75730

      112.1

      111.6

      111.4

      112.8

      113.7

      116.1

      (A). Food Articles

      15.97835

      113.9

      113.1

      112.8

      114.2

      115

      117.3

      (B). Non-Food Articles

      5.52841

      107

      107.3

      107.4

      107.6

      108.4

      110.4

      (C). Minerals

      1.25054

      111.1

      112

      110.8

      118.8

      119.7

      125.1

      II. FUEL AND POWER

      14.11433

      88

      89

      93.5

      111

      113

      111.1

      (A). Coal and Lignite

      0.74136

      86.2

      86.5

      87.8

      87.7

      86.6

      87.9

      (B). Mineral Oils

      8.19208

      84.6

      85.8

      92.9

      121.6

      125.7

      122.9

      (C). Electricity

      4.46349

      94.5

      94.7

      91.2

      90.8

      90.3

      91.9

      (D). Crude Petroleum & Natural Gas

      0.71740

      88.7

      92.4

      119.7

      138.8

      136.8

      120.2

      III. MANUFACTURED PRODUCTS

      63.12837

      102

      103.2

      104.7

      107

      107.8

      107.8

      (A). Manufacture of Food Products

      9.02016

      107

      108

      109.1

      111

      112.3

      113.1

      (B). Manufacture of Beverages

      0.90483

      102.9

      102.6

      102.7

      104.4

      105.3

      105.4

      (C). Manufacture of Tobacco Products

      0.27645

      110.6

      122.7

      122.6

      122.5

      123.7

      124.3

      (D). Manufacture of Textiles

      4.08993

      93.3

      94.4

      96.4

      99.1

      101.4

      102.2

      (E). Manufacture of Wearing Apparel

      1.32948

      109.9

      109.8

      109.9

      111

      112.2

      111.9

      (F). Manufacture of Leather and Related Products

      0.54137

      104.3

      104.9

      105.5

      107.3

      108.5

      108.6

      (G). Manufacture Of Wood and Products of Wood and Cork, except Furniture; Manufacture of Articles of Straw and Plaiting Materials

      1.07718

      109.9

      110

      112.1

      115.2

      116.1

      116.9

      (H). Manufacture of Paper and Paper Products

      1.15328

      90.1

      90.6

      91.4

      93.7

      93.9

      93.8

      (I). Printing and Reproduction of Recorded Media

      0.42618

      104.8

      105.1

      105.8

      107

      108.3

      107

      (J). Manufacture of Chemicals and Chemical Products

      6.12567

      91

      91.8

      96.5

      102.6

      102.4

      102.4

      (K). Manufacture of Basic Pharmaceutical Products and Pharmaceutical Preparations 

      2.20102

      99.6

      99.6

      100.8

      102.3

      102.3

      102.2

      (L). Manufacture of Rubber and Plastic Products

      2.71467

      95.5

      96.3

      101.9

      106

      105.1

      106.2

      (M). Manufacture of Other Non-Metallic Mineral Products

      2.84074

      96.3

      96.1

      96.8

      99

      98.9

      99.6

      (N). Manufacture of Basic Metals

      8.41133

      95.2

      98

      100.1

      103.5

      104.1

      103.1

      (O). Manufacture of Fabricated Metal Products, except Machinery and Equipment

      4.13294

      100.9

      102

      102.7

      104.4

      105.8

      105.7

      (P). Manufacture of Computer, Electronic and Optical Products

      2.07628

      101.2

      101.5

      102

      101.7

      103.4

      102.7

      (Q). Manufacture of Electrical Equipment

      2.64318

      108.5

      110.2

      111

      112.7

      114.1

      114.8

      (R). Manufacture of Machinery and Equipment n.e.c.

      3.46796

      103.9

      104.3

      104.3

      105.1

      105.4

      105.4

      (S). Manufacture of Motor Vehicles, Trailers and Semi-Trailers

      5.43645

      105.9

      106.4

      105.9

      106.7

      108.5

      107.1

      (T). Manufacture of Other Transport Equipment

      1.39511

      105.1

      105.2

      105.4

      106

      106.6

      106.5

      (U). Manufacture of Furniture

      0.82618

      102

      102.6

      102.8

      105.6

      106.1

      106.4

      (V). Other Manufacturing

      2.03798

      152.4

      156.4

      158.8

      157

      158.8

      156.6

      FOOD INDEX

      24.99851

      111.4

      111.3

      111.5

      113

      114

      115.8

       (P)-Provisional, (F)-Final

        Annexure-II

      WPI Inflation Rate (YoY) for All Commodities, Major Groups, and Groups for last six months

      Groups/Major Groups

      Commodity Weight

      Jan-26
      (F)

      Feb-26
      (F)

      Mar-26
      (F)

      Apr-26
      (F)

      May-26
      (P)

      Jun-26
      (P)

      ALL COMMODITIES

      100.00000

      1.19

      2.18

      3.98

      8.36

      9.68

      9.87

      I. PRIMARY ARTICLES

      22.75730

      -0.09

      1.64

      2.58

      3.96

      4.99

      7

      (A). Food Articles

      15.97835

      -1.3

      0.8

      1.53

      2.61

      3.6

      5.49

      (B). Non-Food Articles

      5.52841

      3.98

      4.68

      6.65

      7.6

      9.49

      11.07

      (C). Minerals

      1.25054

      -0.45

      1.36

      0.09

      8

      4.91

      9.45

      II. FUEL AND POWER

      14.11433

      -3.83

      -3.37

      3.2

      25

      30.33

      27.41

      (A). Coal and Lignite

      0.74136

      -3.9

      -2.37

      -0.79

      -1.57

      -2.26

      -1.57

      (B). Mineral Oils

      8.19208

      -4.19

      -4.35

      4.26

      40.74

      49.82

      46.48

      (C). Electricity

      4.46349

      -2.28

      -1.56

      -2.04

      -2.58

      -1.85

      -0.76

      (D). Crude Petroleum & Natural Gas

      0.71740

      -9.95

      -5.33

      26.13

      56.31

      61.51

      34.75

      III. MANUFACTURED PRODUCTS

      63.12837

      2.82

      3.61

      4.8

      6.68

      7.48

      7.48

      (A). Manufacture of Food Products

      9.02016

      1.61

      2.08

      2.54

      4.72

      6.14

      7.2

      (B). Manufacture of Beverages

      0.90483

      -1.06

      -0.68

      -0.68

      0.38

      1.64

      1.44

      (C). Manufacture of Tobacco Products

      0.27645

      2.03

      12.57

      11.86

      12.08

      13.59

      14.14

      (D). Manufacture of Textiles

      4.08993

      0.97

      1.94

      4.9

      7.25

      10.22

      10.85

      (E). Manufacture of Wearing Apparel

      1.32948

      3.78

      3.39

      2.9

      3.06

      4.28

      2.57

      (F). Manufacture of Leather and Related Products

      0.54137

      2.05

      2.64

      3.23

      3.87

      4.33

      3.63

      (G). Manufacture Of Wood and Products of Wood and Cork, except Furniture; Manufacture of Articles of Straw and Plaiting Materials

      1.07718

      3.1

      3

      5.06

      8.07

      7.6

      9.05

      (H). Manufacture of Paper and Paper Products

      1.15328

      -0.88

      -0.66

      0.11

      2.18

      2.74

      3.19

      (I). Printing and Reproduction of Recorded Media

      0.42618

      1.16

      1.55

      2.12

      3.08

      4.13

      2.49

      (J). Manufacture of Chemicals and Chemical Products

      6.12567

      -0.33

      0.22

      5.7

      13

      13.4

      12.78

      (K). Manufacture of Basic Pharmaceutical Products and Pharmaceutical Preparations 

      2.20102

      0.1

      0.3

      1.1

      2.61

      3.33

      2.82

      (L). Manufacture of Rubber and Plastic Products

      2.71467

      -1.24

      -0.72

      5.38

      10.07

      9.59

      9.94

      (M). Manufacture of Other Non-Metallic Mineral Products

      2.84074

      -0.31

      -0.93

      -0.1

      1.75

      1.02

      1.84

      (N). Manufacture of Basic Metals

      8.41133

      5.19

      7.34

      8.57

      10.7

      12.3

      12.31

      (O). Manufacture of Fabricated Metal Products, except Machinery and Equipment

      4.13294

      2.54

      2.82

      3.42

      5.03

      6.22

      6.12

      (P). Manufacture of Computer, Electronic and Optical Products

      2.07628

      1.3

      0.89

      -0.58

      -1.17

      -0.19

      -1.53

      (Q). Manufacture of Electrical Equipment

      2.64318

      6.69

      7.62

      7.98

      9.21

      11.32

      11.03

      (R). Manufacture of Machinery and Equipment n.e.c.

      3.46796

      0.78

      1.26

      1.07

      1.84

      2.33

      2.13

      (S). Manufacture of Motor Vehicles, Trailers and Semi-Trailers

      5.43645

      0.38

      1.82

      0.95

      0.85

      2.17

      1.71

      (T). Manufacture of Other Transport Equipment

      1.39511

      2.34

      1.74

      1.93

      3.21

      4.31

      4

      (U). Manufacture of Furniture

      0.82618

      -0.58

      -0.1

      0.19

      3.83

      5.68

      5.03

      (V). Other Manufacturing

      2.03798

      32.52

      31.54

      32.89

      26.21

      21.87

      20.55

      FOOD INDEX

      24.99851

      -0.36

      1.27

      1.92

      3.29

      4.49

      6.14

       (P)-Provisional, (F)-Final

      Annexure-III

      Cumulative WPI for All Commodities, Major Groups, and Groups

      Groups/Major Groups

      Commodity Weight

      Apr-Jun 2023

      Apr-Jun 2024

      Apr-Jun 2025

      Apr-Jun 2026

      ALL COMMODITIES

      100.00000

      98.6

      100.3

      100.3

      109.7

      I. PRIMARY ARTICLES

      22.75730

      102.5

      110.2

      108.4

      114.2

      (A). Food Articles

      15.97835

      103.9

      114.2

      111.2

      115.5

      (B). Non-Food Articles

      5.52841

      98.9

      98

      99.5

      108.8

      (C). Minerals

      1.25054

      100.8

      113.8

      112.8

      121.2

      II. FUEL AND POWER

      14.11433

      92

      91.2

      87.6

      111.7

      (A). Coal and Lignite

      0.74136

      92.6

      89.3

      89

      87.4

      (B). Mineral Oils

      8.19208

      89.9

      90

      84.7

      123.4

      (C). Electricity

      4.46349

      95.2

      92

      92.6

      91

      (D). Crude Petroleum & Natural Gas

      0.71740

      94.3

      101.5

      87.6

      131.9

      III. MANUFACTURED PRODUCTS

      63.12837

      98.7

      98.8

      100.3

      107.5

      (A). Manufacture of Food Products

      9.02016

      98.2

      100.3

      105.8

      112.1

      (B). Manufacture of Beverages

      0.90483

      102.4

      103.7

      103.8

      105

      (C). Manufacture of Tobacco Products

      0.27645

      103.9

      106.8

      109

      123.5

      (D). Manufacture of Textiles

      4.08993

      93.6

      92.7

      92.2

      100.9

      (E). Manufacture of Wearing Apparel

      1.32948

      102.4

      104.2

      108.1

      111.7

      (F). Manufacture of Leather and Related Products

      0.54137

      101.3

      101.3

      104

      108.1

      (G). Manufacture Of Wood and Products of Wood and Cork, except Furniture; Manufacture of Articles of Straw and Plaiting Materials

      1.07718

      102

      103.1

      107.2

      116.1

      (H). Manufacture of Paper and Paper Products

      1.15328

      92.6

      89.2

      91.3

      93.8

      (I). Printing and Reproduction of Recorded Media

      0.42618

      103.1

      104.3

      104.1

      107.4

      (J). Manufacture of Chemicals and Chemical Products

      6.12567

      93.9

      91.1

      90.6

      102.5

      (K). Manufacture of Basic Pharmaceutical Products and Pharmaceutical Preparations 

      2.20102

      101

      99.4

      99.4

      102.3

      (L). Manufacture of Rubber and Plastic Products

      2.71467

      96.1

      95.4

      96.3

      105.8

      (M). Manufacture of Other Non-Metallic Mineral Products

      2.84074

      99.3

      96.5

      97.7

      99.2

      (N). Manufacture of Basic Metals

      8.41133

      96.4

      94.7

      92.7

      103.6

      (O). Manufacture of Fabricated Metal Products, except Machinery and Equipment

      4.13294

      100.4

      100.2

      99.5

      105.3

      (P). Manufacture of Computer, Electronic and Optical Products

      2.07628

      98.5

      96.5

      103.6

      102.6

      (Q). Manufacture of Electrical Equipment

      2.64318

      100.8

      101.8

      103

      113.9

      (R). Manufacture of Machinery and Equipment n.e.c.

      3.46796

      102.1

      102.2

      103.1

      105.3

      (S). Manufacture of Motor Vehicles, Trailers and Semi-Trailers

      5.43645

      103.1

      106.3

      105.8

      107.4

      (T). Manufacture of Other Transport Equipment

      1.39511

      101

      101.3

      102.4

      106.4

      (U). Manufacture of Furniture

      0.82618

      101.9

      101.6

      101.1

      106

      (V). Other Manufacturing

      2.03798

      104.7

      113

      128.2

      157.5

      FOOD INDEX

      24.99851

      101.9

      109.2

      109.2

      114.3

      Note: Cumulative Index has been calculated by taking Arithmetic Mean of 3 months indices


      Annexure-IV

       Cumulative WPI Inflation Rate (YoY) for All Commodities, Major Groups, and Groups

      Groups/Major Groups

      Weight

      Apr-Jun 2024

      Apr-Jun 2025

      Apr-Jun 2026

      All Commodities

      100.00000

      1.72

      0

      9.37

      I. Primary Articles

      22.75730

      7.51

      -1.63

      5.35

      (A). Food Articles

      15.97835

      9.91

      -2.63

      3.87

      (B). Non-Food Articles

      5.52841

      -0.91

      1.53

      9.35

      (C). Minerals

      1.25054

      12.9

      -0.88

      7.45

      II. Fuel and Power

      14.11433

      -0.87

      -3.95

      27.51

      (A). Coal and Lignite

      0.74136

      -3.56

      -0.34

      -1.8

      (B). Mineral Oils

      8.19208

      0.11

      -5.89

      45.69

      (C). Electricity

      4.46349

      -3.36

      0.65

      -1.73

      (D). Crude Petroleum & Natural Gas

      0.71740

      7.64

      -13.69

      50.57

      III. Manufactured Products

      63.12837

      0.1

      1.52

      7.18

      (A). Manufacture of Food Products

      9.02016

      2.14

      5.48

      5.95

      (B). Manufacture of Beverages

      0.90483

      1.27

      0.1

      1.16

      (C). Manufacture of Tobacco Products

      0.27645

      2.79

      2.06

      13.3

      (D). Manufacture of Textiles

      4.08993

      -0.96

      -0.54

      9.44

      (E). Manufacture of Wearing Apparel

      1.32948

      1.76

      3.74

      3.33

      (F). Manufacture of Leather and Related Products

      0.54137

      0

      2.67

      3.94

      (G). Manufacture of Wood and Products of Wood and Cork, except Furniture; Manufacture of Articles of Straw and Plaiting Materials

      1.07718

      1.08

      3.98

      8.3

      (H). Manufacture of Paper and Paper Products

      1.15328

      -3.67

      2.35

      2.74

      (I). Printing and Reproduction of Recorded Media

      0.42618

      1.16

      -0.19

      3.17

      (J). Manufacture of Chemicals and Chemical Products

      6.12567

      -2.98

      -0.55

      13.13

      (K). Manufacture of Basic Pharmaceutical Products and Pharmaceutical Preparations 

      2.20102

      -1.58

      0

      2.92

      (L). Manufacture of Rubber and Plastic Products

      2.71467

      -0.73

      0.94

      9.87

      (M). Manufacture of Other Non-Metallic Mineral Products

      2.84074

      -2.82

      1.24

      1.54

      (N). Manufacture of Basic Metals

      8.41133

      -1.76

      -2.11

      11.76

      (O). Manufacture of Fabricated Metal Products, except Machinery and Equipment

      4.13294

      -0.2

      -0.7

      5.83

      (P). Manufacture of Computer, Electronic and Optical Products

      2.07628

      -2.03

      7.36

      -0.97

      (Q). Manufacture of Electrical Equipment

      2.64318

      0.99

      1.18

      10.58

      (R). Manufacture of Machinery and Equipment n.e.c.

      3.46796

      0.1

      0.88

      2.13

      (S). Manufacture of Motor Vehicles, Trailers and Semi-Trailers

      5.43645

      3.1

      -0.47

      1.51

      (T). Manufacture of Other Transport Equipment

      1.39511

      0.3

      1.09

      3.91

      (U). Manufacture of Furniture

      0.82618

      -0.29

      -0.49

      4.85

      (V). Other Manufacturing

      2.03798

      7.93

      13.45

      22.85

      Food Index

      24.99851

      7.16

      0

      4.67

      Provisional Estimates of Output Producer Price Index (Base Year 2022-23) for the month of June 2026

      1. Key highlights of Output PPI (Base Year 2022-23) for June 2026
      1. All India Output PPI for All Commodities for June 2026 stands at 109.9, whereas it was 109.6 in May 2026.
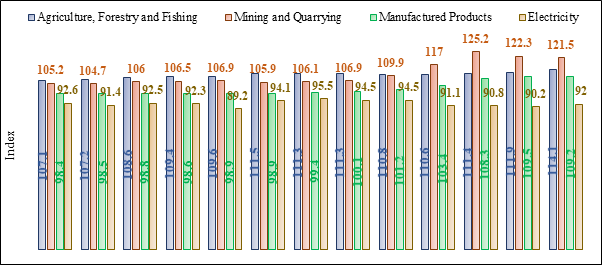
      2. WPI indices for Agriculture, Forestry and Fishing; Mining and Quarrying; Manufactured Products; and Electricity are 114.1, 121.5, 109.2, and 92.0, respectively, in June 2026, whereas they were 111.9, 122.3, 109.5, and 90.2, respectively, in May 2026.
      3. Monthly indices for All Commodities and Major Groups, for the past 13 months are presented in the charts below.

      Chart 5: Output PPI for All Commodities
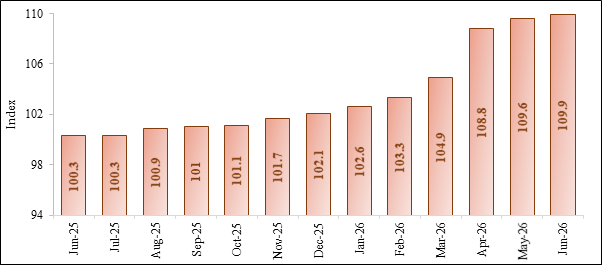
      Chart 6: Output PPI across Major Groups
      1. The final index of Output PPI for the month of April 2026 has been revised from 108.6 (Provisional estimate) to 108.8.
      2. Output PPI for All Commodities, Major Groups, and Groups for the last six months is given at Annexure-V.
      3. Cumulative Output PPI for All Commodities, Major Groups, and Groups from April to June for FY for FY 2023-24, FY 2024-25, FY 2025-26, and FY 2026-27 is given at Annexure-VI.
      4. SUT category-wise index pertaining to Output PPI (Base Year 2022-23) series from April 2023 to June 2026 is available at (https://eaindustry.nic.in/download_data_2223.asp).

      Annexure-V

      Output PPI for All Commodities, Major Groups and Groups for last six months

      Groups/Major Groups

      Weight

      Jan-26 (F)

      Feb-26 (F)

      Mar-26 (F)

      Apr-26 (F)

      May-26 (P)

      Jun-26 (P)

      ALL COMMODITIES

      100.00000

      102.6

      103.3

      104.9

      108.8

      109.6

      109.9

      AGRICULTURE, FORESTRY AND FISHING

      22.15648

      111.3

      110.8

      110.6

      111.4

      111.9

      114.1

      Crop and Animal Production, Hunting and Related Service Activities 

      19.03219

      111.7

      111.3

      111

      111.5

      111.8

      114.3

      Forestry and Logging

      1.67481

      114.4

      115

      115.4

      116.7

      117.2

      118

      Fishing and Aquaculture

      1.44948

      102.7

      99.3

      100.1

      103.2

      106.9

      106.6

      MINING AND QUARRYING

      3.42065

      106.9

      109.9

      117

      125.2

      122.3

      121.5

      Mining of Metal Ores

      0.70792

      158.6

      168

      171.5

      174.7

      174.8

      178.7

      Mining of Coal and Lignite

      0.7398

      86.2

      86.5

      87.8

      87.7

      86.6

      87.9

      Other Mining and Quarrying

      1.23208

      103.2

      103.2

      100.5

      109.9

      105.2

      113.1

      Extraction of Crude Petroleum and Natural Gas

      0.74085

      84.5

      88.9

      121.7

      141

      136.2

      114.2

      MANUFACTURED PRODUCTS

      69.93568

      100.1

      101.2

      103.4

      108.3

      109.5

      109.2

      (A). Manufacture of Food Products

      8.47196

      107.5

      108.3

      109.2

      111

      112.2

      113.2

      (B). Manufacture of Beverages

      0.8417

      103.1

      102.7

      102.8

      104.6

      105.5

      105.5

      (C). Manufacture of Tobacco Products

      0.25705

      111.9

      125.9

      125.9

      125.4

      126.7

      127.4

      (D). Manufacture of Textiles

      4.38774

      93.7

      95

      97.8

      100.9

      103.1

      104.3

      (E). Manufacture of Wearing Apparel

      1.20494

      108.8

      108.7

      108.7

      109.9

      111.2

      110.8

      (F). Manufacture of Leather and Related Products

      0.49989

      103.1

      103.6

      104.2

      105.9

      107.2

      107.3

      (G). Manufacture of Wood and Products of Wood and Cork, except Furniture; Manufacture of Articles of Straw and Plaiting Materials

      1.08949

      108.1

      108.3

      110.3

      113.3

      114.4

      114.8

      (H). Manufacture of Paper and Paper Products

      1.03128

      90.3

      90.7

      91.6

      93.9

      94.1

      94.1

      (I). Printing and Reproduction of Recorded Media

      0.30931

      105.6

      106.1

      107.1

      109.3

      109.4

      109.6

      (J). Manufacture of Coke and Refined Petroleum Products

      7.14818

      84.5

      85.7

      92.7

      121.1

      125.1

      122.3

      (K). Manufacture of Chemicals and Chemical Products

      5.74793

      91.5

      92.2

      97.3

      103.3

      102.7

      103

      (L). Manufacture of Basic Pharmaceuticals, Medicinal Chemical and Botanical Products

      1.92807

      100.7

      100.6

      101.8

      103.2

      103.1

      103

      (M). Manufacture of Rubber and Plastic Products

      2.57252

      95.9

      96.9

      102.5

      106.7

      105.7

      106.8

      (N). Manufacture of Other Non-Metallic Mineral Products

      2.50437

      96

      95.8

      96.4

      99

      98.7

      99.5

      (O). Manufacture of Basic Metals

      7.465

      94.3

      96.6

      99

      102.7

      103.9

      102.7

      (P). Manufacture of Fabricated Metal Products, except Machinery and Equipment

      3.15198

      99.3

      100.4

      101.1

      102.3

      103.6

      104

      (Q). Manufacture of Computer, Electronic and Optical Products

      1.7748

      104.4

      104.6

      104.6

      104.3

      106

      104.7

      (R). Manufacture of Electrical Equipment

      3.81453

      103.1

      104

      104.4

      105.7

      107.1

      107.9

      (S). Manufacture of Machinery and Equipment n.e.c.

      2.46158

      104.1

      104.7

      104.8

      105.7

      105.7

      105.6

      (T). Manufacture of Motor Vehicles, Trailers and Semi-Trailers

      4.39321

      106.4

      106.9

      106.6

      107.4

      108.8

      107.6

      (U). Manufacture of Other Transport Equipment

      1.34392

      106

      106.1

      106.4

      107.2

      107.5

      107.6

      (V). Manufacture of Furniture

      0.73566

      102.9

      103.2

      103.7

      105.3

      105.2

      105.4

      (W). Other Manufacturing

      6.80057

      115.9

      118.3

      119.9

      120.9

      122

      121

      ELECTRICITY

      4.48719

      94.5

      94.5

      91.1

      90.8

      90.2

      92

      Electricity

      4.48719

      94.5

      94.5

      91.1

      90.8

      90.2

      92

        (P)-Provisional, (F)-Final

      Annexure-VI

      Cumulative Output PPI for All Commodities, Major Groups and Groups

      Groups/Major Groups

      Weight

      Apr-Jun 2023-24

      Apr-Jun 2024-25

      Apr-Jun 2025-26

      Apr-Jun 2026-27

      ALL COMMODITIES

      100.00000

      98.6

      100.1

      100.3

      109.4

      AGRICULTURE, FORESTRY AND FISHING

      22.15648

      102.8

      108.6

      107.2

      112.5

      Crop and Animal Production, Hunting and Related Service Activities 

      19.03219

      102.7

      108.7

      106.9

      112.5

      Forestry and Logging

      1.67481

      102.5

      112.7

      115.1

      117.3

      Fishing and Aquaculture

      1.44948

      104.5

      102.2

      101.6

      105.6

      MINING AND QUARRYING

      3.42065

      97.1

      105.6

      103.5

      123

      Mining of Metal Ores

      0.70792

      107

      126.3

      141.8

      176.1

      Mining of Coal and Lignite

      0.7398

      92.6

      89.3

      89

      87.4

      Other Mining and Quarrying

      1.23208

      98.4

      107.9

      102.9

      109.4

      Extraction of Crude Petroleum and Natural Gas

      0.74085

      89.9

      98.2

      82.6

      130.5

      MANUFACTURED PRODUCTS

      69.93568

      97.6

      97.6

      98.5

      109

      (A). Manufacture of Food Products

      8.47196

      97.1

      99.5

      105.7

      112.1

      (B). Manufacture of Beverages

      0.8417

      102.5

      103.9

      104

      105.2

      (C). Manufacture of Tobacco Products

      0.25705

      103.8

      106.8

      109.3

      126.5

      (D). Manufacture of Textiles

      4.38774

      93.7

      93

      92.4

      102.8

      (E). Manufacture of Wearing Apparel

      1.20494

      101.9

      103.3

      107.3

      110.6

      (F). Manufacture of Leather and Related Products

      0.49989

      100.8

      100.3

      102.6

      106.8

      (G). Manufacture of Wood and Products of Wood and Cork, except Furniture; Manufacture of Articles of Straw and Plaiting Materials

      1.08949

      102

      102.6

      106.1

      114.2

      (H). Manufacture of Paper and Paper Products

      1.03128

      92.6

      89.3

      91.5

      94

      (I). Printing and Reproduction of Recorded Media

      0.30931

      103.8

      105

      105.3

      109.4

      (J). Manufacture of Coke and Refined Petroleum Products

      7.14818

      90

      90

      84.7

      122.8

      (K). Manufacture of Chemicals and Chemical Products

      5.74793

      94.1

      91.2

      91.1

      103

      (L). Manufacture of Basic Pharmaceuticals, Medicinal Chemical and Botanical Products

      1.92807

      101.7

      99.2

      99.4

      103.1

      (M). Manufacture of Rubber and Plastic Products

      2.57252

      96.2

      95.5

      96.3

      106.4

      (N). Manufacture of Other Non-Metallic Mineral Products

      2.50437

      99.1

      96.2

      97.1

      99.1

      (O). Manufacture of Basic Metals

      7.465

      96.2

      94.6

      92

      103.1

      (P). Manufacture of Fabricated Metal Products, except Machinery and Equipment

      3.15198

      99.5

      99.5

      98.4

      103.3

      (Q). Manufacture of Computer, Electronic and Optical Products

      1.7748

      98.4

      95.7

      107.1

      105

      (R). Manufacture of Electrical Equipment

      3.81453

      99.8

      99.3

      100.6

      106.9

      (S). Manufacture of Machinery and Equipment n.e.c.

      2.46158

      102.2

      102.7

      103.2

      105.7

      (T). Manufacture of Motor Vehicles, Trailers and Semi-Trailers

      4.39321

      103.3

      106.5

      106

      107.9

      (U). Manufacture of Other Transport Equipment

      1.34392

      101.4

      101.6

      103.4

      107.4

      (V). Manufacture of Furniture

      0.73566

      101.9

      101.4

      101.5

      105.3

      (W). Other Manufacturing

      6.80057

      101.6

      103.1

      108.1

      121.3

      ELECTRICITY

      4.48719

      95.2

      92

      92.6

      91

      Electricity

      4.48719

      95.2

      92

      92.6

      91

      Note: Cumulative Index has been calculated by taking Arithmetic Mean of 3 months indices

      Provisional Estimates of Trial Input Producer Price Index (IPPI) (Base Year 2022-23) for the month of June 2026

      1. All India trial Input PPI for Manufacturing Sector for June 2026 stands at 107.1 (Provisional estimate).
      2. Trial Input PPI for Manufacturing Sector for the month of April 2026 has been revised from 104.9 (provisional estimate) to 104.2 (final estimate).
      3. Trial Input PPI for all Manufacturing Industries at NIC-2-digit, for the months of March, April May, and June 2026 is given below.

      Trial Input PPI for all Manufacturing Industries at NIC-2-digit

      Industry Group

      Weight

      Mar-26
      (F)

      Apr-26
      (F)

      May-26
      (P)

      Jun-26
      (P)

      Manufacturing Sector

      100.00000

      100.9

      104.2

      104.9

      107.1

      (A). Manufacture of Food Products

      14.84638

      107.1

      108.3

      110.5

      112.2

      (B). Manufacture of Beverages

      1.03035

      106

      104.5

      104.8

      105.5

      (C). Manufacture of Tobacco Products

      0.26443

      128

      124.7

      125.7

      123.4

      (D). Manufacture of Textiles

      5.88918

      95.5

      100.8

      103.1

      107.8

      (E). Manufacture of Wearing Apparel

      1.57012

      105.6

      106.6

      108.3

      109.6

      (F). Manufacture of Leather and Related Products

      0.77634

      96.3

      96

      96.2

      96

      (G). Manufacture of Wood and Products of Wood and Cork, Except Furniture; Manufacture of Articles of Straw and Plaiting Materials

      1.82194

      99.7

      110.8

      110.8

      112.3

      (H). Manufacture of Paper and Paper Products

      0.87494

      95.1

      96.8

      97.1

      97

      (I). Printing and Reproduction of Recorded Media

      0.46606

      96.4

      98.3

      101.2

      98.5

      (J). Manufacture of Coke and Refined Petroleum Products

      12.3291

      98.2

      105.2

      105.8

      113.5

      (K). Manufacture of Chemicals and Chemical Products

      7.98919

      100.9

      107.9

      111.8

      112.5

      (L). Manufacture of Basic Pharmaceutical Products and Pharmaceutical Preparations 

      2.40463

      98.2

      103.5

      104.9

      105.6

      (M). Manufacture of Rubber and Plastic Products

      3.40235

      105.9

      109.8

      111.9

      112.1

      (N). Manufacture of Other Non-Metallic Mineral Products

      3.28306

      92.3

      96.4

      93.2

      92.6

      (O). Manufacture of Basic Metals

      11.25229

      98.3

      100.6

      98.5

      99.2

      (P). Manufacture of Fabricated Metal Products, except Machinery and Equipment

      5.59239

      99.7

      102.2

      103.9

      105.4

      (Q). Manufacture of Computer, Electronic and Optical Products

      2.22964

      108

      108.2

      108.4

      111.5

      (R). Manufacture of Electrical Equipment

      3.64437

      111.5

      113.4

      115.8

      117.7

      (S). Manufacture of Machinery and Equipment n.e.c.

      5.07784

      102.2

      105

      102.7

      105.3

      (T). Manufacture of Motor Vehicles, Trailers and Semi-Trailers, and Manufacture of Other Transport Equipment

      10.49446

      101.5

      102.8

      104.1

      104.9

      (U). Manufacture of Furniture

      0.98353

      97.6

      101.1

      101.6

      98.6

      (V). Other Manufacturing

      3.77741

      88.9

      88.4

      83.1

      88

       (P)-Provisional, (F)-Final

      Topics

      ActsIncome Tax

