 TaxTMI
 Login
Just a moment...

Press 'Enter' to add multiple search terms. Rules for Better Search
 of 3351
Press 'Enter' after typing page number.
of 3351Press 'Enter' after typing page number.


No Folders have been created
Are you sure you want to delete "My most important" ?
NOTE:
of 3351Press 'Enter' after typing page number.
of 3351Press 'Enter' after typing page number.

All News
of 3351Press 'Enter' after typing page number.
All News
 Join Channel
Note

Bookmark

Share


The cumulative value of merchandise exports during April-June 2026-27 was US$ 129.32 Billion, as compared to US$ 111.57 Billion during April-June 2025-26, registering a positive growth of 15.92%.
The cumulative Non-Petroleum exports in April-June 2026-27 valued at US$ 106.30 Billion registered an increase of 12.44% as compared to US$ 94.54 Billion in April-June 2025-26.
Major drivers of merchandise exports growth in June 2026 include Gems & Jewellery, Engineering Goods, Organic & Inorganic Chemicals, Electronic Goods, and Rice
Gems & Jewellery exports increased by 34.64% from US$ 1.79 Billion in June 2025 to US$ 2.41 Billion in June 2026.
Engineering Goods exports increased by 20.74% from US$ 9.51 Billion in June 2025 to US$ 11.48 Billion in June 2026.
Organic & Inorganic Chemicals exports increased by 19.42% from US$ 2.32 Billion in June 2025 to US$ 2.77 Billion in June 2026.
Electronic Goods exports increased by 18.93% from US$ 4.14 Billion in June 2025 to US$ 4.93 Billion in June 2026.
Rice exports increased by 16.48% from US$ 0.86 Billion in June 2025 to US$ 1.00 Billion in June 2026.
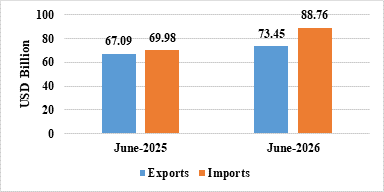
India’s total exports (Merchandise and Services combined) for June 2026* is estimated at US$ 73.45 Billion, registering a positive growth of 9.48 percent vis-à-vis June 2025. Total imports (Merchandise and Services combined) for June 2026* is estimated at US$ 88.76 Billion, registering a positive growth of 26.85 percent vis-à-vis June 2025.
Table 1: Trade during June 2026*
|
| June 2026 (US$ Billion) | June 2025 (US$ Billion) |
Merchandise | Exports | 40.41 | 34.98 |
Imports | 70.84 | 54.08 | |
Services* | Exports | 33.03 | 32.11 |
Imports | 17.92 | 15.90 | |
Total Trade (Merchandise +Services) * | Exports | 73.45 | 67.09 |
Imports | 88.76 | 69.98 | |
Trade Balance | -15.32 | -2.89 |
* Note: The latest data for services sector released by RBI is for May 2026. The data for June 2026 is an estimation. (ii) Data for April-June 2025-26 has been revised on pro-rata basis using quarterly balance of payments data.
Fig 1: Total Trade during June 2026*
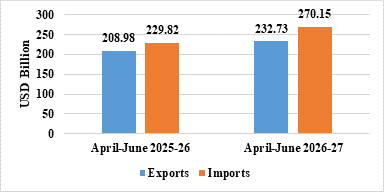
India’s total exports during April-June 2026-27* is estimated at US$ 232.73 Billion registering a positive growth of 11.37 percent. Total imports during April-June 2026-27* is estimated at US$ 270.15 Billion registering a growth of 17.55 percent.
Table 2: Trade during April-June 2026-27*
|
| April-June 2026-27 (US$ Billion) | April-June 2025-26 (US$ Billion) |
Merchandise | Exports | 129.32 | 111.57 |
Imports | 216.18 | 180.31 | |
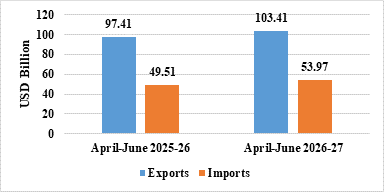
Services* | Exports | 103.41 | 97.41 |
Imports | 53.97 | 49.51 | |
Total Trade (Merchandise +Services) * | Exports | 232.73 | 208.98 |
Imports | 270.15 | 229.82 | |
Trade Balance | -37.42 | -20.85 |
Fig 2: Total Trade during April-June 2026-27*
MERCHANDISE TRADE
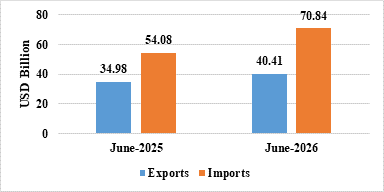
Merchandise exports during June 2026 were US$ 40.41 Billion as compared to US$ 34.98 Billion in June 2025.
Merchandise imports during June 2026 were US$ 70.84 Billion as compared to US$ 54.08 Billion in June 2025.
Fig 3: Merchandise Trade during June 2026
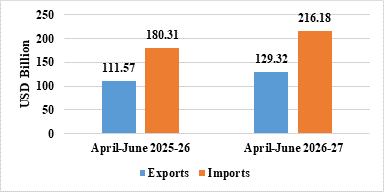
Merchandise exports during April-June 2026-27 were US$ 129.32 Billion as compared to US$ 111.57 Billion during April-June 2025-26.
Merchandise imports during April-June 2026-27 were US$ 216.18 Billion as compared to US$ 180.31 Billion during April-June 2025-26.
Merchandise trade deficit during April-June 2026-27 was US$ 86.86Billion as compared to US$ 68.75Billion during April-June 2025-26.
Fig 4: Merchandise Trade during April-June 2026-27
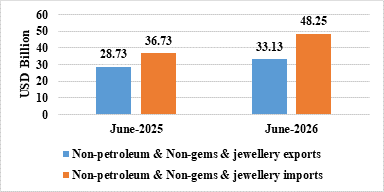
Non-petroleum and non-gems & jewellery exports in June 2026 were US$ 33.13 Billion compared to US$ 28.73 Billion in June 2025.
Non-petroleum, non-gems & jewellery (gold, silver & precious metals) imports in June 2026 were US$ 48.25 Billion compared to US$ 36.73 Billion in June 2025.
Table 3: Trade excluding Petroleum and Gems & Jewellery during June 2026
| June 2026 (US$ Billion) | June 2025 (US$ Billion) |
Non- petroleum exports | 35.54 | 30.51 |
Non- petroleum imports | 51.52 | 40.28 |
Non-petroleum & Non-Gems & Jewellery exports | 33.13 | 28.73 |
Non-petroleum & Non-Gems & Jewellery imports | 48.25 | 36.73 |
Note: Gems & Jewellery Imports include Gold, Silver & Pearls, precious & Semi-precious stones
Fig 5: Trade excluding Petroleum and Gems & Jewellery during June 2026
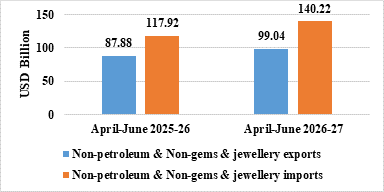
Non-petroleum and non-gems & jewellery exports in April-June 2026-27 were US$ 99.04 Billion, compared to US$ 87.88 Billion in April-June 2025-26.
Non-petroleum, non-gems & jewellery (gold, silver & precious metals) imports in April-June 2026-27 were US$ 140.22 Billion, compared to US$ 117.92 Billion in April-June 2025-26.
Table 4: Trade excluding Petroleum and Gems & Jewellery during April-June 2026-27
| April-June 2026-27 (US$ Billion) | April-June 2025-26 (US$ Billion) |
Non- petroleum exports | 106.30 | 94.54 |
Non- petroleum imports | 155.56 | 131.07 |
Non-petroleum & Non Gems & Jewellery exports | 99.04 | 87.88 |
Non-petroleum & Non Gems & Jewellery imports | 140.22 | 117.92 |
Note: Gems & Jewellery Imports include Gold, Silver & Pearls, precious & Semi-precious stones
Fig 6: Trade excluding Petroleum and Gems & Jewellery during April-June 2026-27
SERVICES TRADE
Fig 7: Services Trade during June 2026*
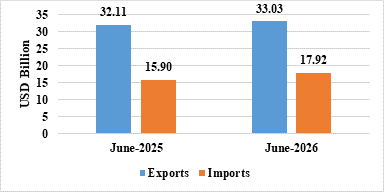
Fig 8: Services Trade during April-June 2026-27*
***
Link for Exim Summary : (i) Export (ii) Import (iii) Country wise – Export (iv) Country wise – Import
 TaxTMI