
Just a moment...

Top
Help
×

By creating an account you can:

Logo TaxTMI
>
Call Us / Help / Feedback

Contact Us At :

E-mail: [email protected]

Call / WhatsApp at: +91 99117 96707

For more information, Check Contact Us

FAQs :

To know Frequently Asked Questions, Check FAQs

Most Asked Video Tutorials :

For more tutorials, Check Video Tutorials

Submit Feedback/Suggestion :

Email :
Please provide your email address so we can follow up on your feedback.
Category :
Description :
Min 15 characters0/2000
Add to...
You have not created any category. Kindly create one to bookmark this item!
Create New Category
Hide
Title :
Description :
❮❮ Hide
Default View
Expand ❯❯
Close ✕
🔎 News - Adv. Search
TEXT SEARCH:

Press 'Enter' to add multiple search terms. Rules for Better Search

Search In:
Main Text + AI Text
  • Main Text
  • Main Text + AI Text
  • AI Text
Category: ?
Categorized by AI
---- All Categories ----
  • ---- All Categories ----
  • Income Tax
  • GST
  • Customs, DGFT & SEZ
  • FEMA & RBI
  • Corp. Laws, SEBI & IBC
  • PMLA, Black Money & ED
  • Budget
  • News and Press Release
  • PTI News
Month:
---- All Months ----
  • ---- All Months ----
  • January
  • February
  • March
  • April
  • May
  • June
  • July
  • August
  • September
  • October
  • November
  • December
Year:
---- All Years ----
  • ---- All Years ----
  • 2026
  • 2025
  • 2024
  • 2023
  • 2022
  • 2021
  • 2020
  • 2019
  • 2018
  • 2017
  • 2016
  • 2015
  • 2014
  • 2013
  • 2012
  • 2011
Sort By: ?
In Sort By 'Default', exact matches for text search are shown at the top, followed by the remaining results in their regular order.
RelevanceDefaultDate
    Direct tax mop-up grows 15 pc to over Rs 5.21 lakh cr on higher advance tax payments
    Andhra CM Naidu directs aquaculture feed firms to cut prices by Rs 4 per kg, manufacturers agree
    Modi, Trump direct officials to swiftly finalise trade pact: Foreign Secretary Misri
    Net income tax collection grows 15 pc to over Rs 5.21 lakh cr till Jun 17
    India to allow import of 3.78 lakh UK cars at concessional duty in first 15 years of trade pact
    Attack on ED officials: Court rejects bail plea of three accused
    Indian money in Swiss banks dips to CHF 3.25 bn; customer deposits up
    Bharat Buildcon 2026 Inaugurated Under the Theme ‘One Nation, One Expo’
    Rahul Gandhi only hugs people of same caste, alleges CPI(M) leader Balan
    India-UK social security pact to benefit 90-95 pc of Indian professionals working in Britain
    OFCD case: SC agrees to hear SEBI's plea against SAT relief to SICCL managers
    Gold imports drop 70 pc to 30 tonnes after duty hike: Official
    ED carries out searches across Kerala in organ donation racket money laundering probe
    India and the United Kingdom Unleash a Next Generation Economic Corridor: Comprehensive Economic and Trade Agreement (CETA) and Agreement on Social Se...
    Modi, Trump direct officials to fast-track 'commercially meaningful' trade Pact
    President Lula warns Trump not to meddle in Brazil's elections
    India to allow reduced-duty import of 3.78 lakh UK cars in first 15 years of trade pact
    NSE Files for Rs 30,000-cr IPO; set to become India's biggest-ever public issue
    India-UK trade pact: 5-yr exemption from social security payments to benefit 75,000 Indian professionals
    India-UK trade pact: 85 pc of India's exports out of British steel measures
❯❯
MaximizeMaximizeMaximize
0 / 200
Expand Note
Add to Folder

No Folders have been created

    +

    Are you sure you want to delete "My most important" ?

    NOTE:

    News
    Showing Results for :
    Reset Filters
    Results Found:
    Show All SummariesHide All Summaries
    June 18, 2026
    Show AI Summary
    Direct tax collections rise on stronger advance tax mop-up and higher corporate tax receipts across key segments.
    Net direct tax collection increased by 14.64 per cent to over Rs 5.21 lakh crore up to June 17 of the fiscal year, driven primarily by higher advance tax mop-up from corporates. Net corporate tax collection rose 22 per cent, while net non-corporate tax collection increased 8 per cent. Securities Transaction Tax collection also recorded strong growth, and advance tax collection rose 15.30 per cent, with corporate and non-corporate advance tax both showing gains.
    June 18, 2026
    Show AI Summary
    Aquaculture feed price stabilisation drives a committee plan, with manufacturers agreeing to reduce prices and review sector concerns.
    Aquaculture feed pricing was addressed as a sectoral price-stabilisation issue, with manufacturers agreeing to reduce prices by Rs 4 per kg after a directive from the Chief Minister. A committee of aqua farmers, feed manufacturers and officials was proposed to develop a long-term mechanism for price stabilisation and to examine processing-related issues and pollution control measures, with recommendations due within 20 days. The discussion also covered subsidy awareness, insurance coverage, nursery ponds, water supply and strict quality control in aquaculture production.
    June 18, 2026
    Show AI Summary
    Interim free trade agreement negotiations advance as leaders urge swift conclusion of the India-US trade pact.
    Trade negotiations between India and the United States were described as being in the final stages of an interim free trade agreement, with both leaders directing their negotiators to conclude the pact at the earliest. The discussions were said to have addressed uncertainty in bilateral trade and to have produced significant progress, with further talks expected to continue through an upcoming visit by the US Trade Representative.
    June 18, 2026
    Show AI Summary
    Direct tax collection growth drives higher net income tax mop-up, with corporate and non-corporate taxes both rising.
    Direct tax collection recorded year-on-year growth during the early part of the fiscal year, with net income tax collection rising to over Rs 5.21 lakh crore by June 17. Net corporate tax collection increased sharply, while net non-corporate tax collection also posted growth; the non-corporate category covers taxes paid by individuals, HUFs and firms. Refunds were issued during the period and showed a marginal increase compared with the corresponding earlier period.
    June 18, 2026
    Show AI Summary
    Phased customs duty cuts on UK passenger car imports set quota limits, price bands and EV concession rules.
    India-UK Comprehensive Economic and Trade Partnership provides for phased, quota-based reduction of customs duty on passenger car imports from the UK into India over the first 15 years of implementation. Conventional-engine passenger cars are subject to specified annual quotas across engine-size categories, with duty reductions tapering to a final 10 per cent, while electric, hybrid and hydrogen passenger cars receive concessions only from the sixth year, subject to price bands and quotas. Zero-emission two-wheelers, buses and trucks are excluded from any customs duty concession commitment.
    June 18, 2026
    Show AI Summary
    Bail petitions in alleged attack on ED officials dismissed amid continuing investigation and attempted murder charges.
    Bail petitions filed by three accused in connection with the alleged attack on Enforcement Directorate officials were dismissed in proceedings arising from the CMRL money laundering probe. The accused argued that the allegations were baseless and that investigation against them had been completed, but the prosecution said investigation was still continuing. The matter relates to an alleged attack on ED and CRPF personnel after searches at the residence of the former Chief Minister, with police invoking multiple offences, including attempted murder.
    June 18, 2026
    Show AI Summary
    Swiss bank deposits by Indian clients fell overall, while individual customer accounts and tax information exchange continued to expand.
    Swiss National Bank data showed that Indian money in Swiss banks fell in 2025 to CHF 3.25 billion, with the decline driven mainly by funds held through local branches and other financial institutions. Customer deposits rose to CHF 524 million, while amounts due to banks remained the largest component at CHF 2.6 billion. Separate locational banking statistics showed an increase in deposits by Indian individuals to USD 89.73 million. The article also notes the automatic exchange of information in tax matters between Switzerland and India since 2018.
    June 18, 2026
    Show AI Summary
    Free Trade Agreements support Indian industry as Bharat Buildcon 2026 showcases construction sector collaboration and global market access.
    Bharat Buildcon 2026 was inaugurated as an industry exhibition for the building materials and construction sector under the theme "One Nation, One Expo". The event brought together participants from more than 90 countries and over 100 Indian cities for industry interaction and business engagement. The Minister highlighted the role of Free Trade Agreements in expanding opportunities for Indian industry, including expected market access and stronger trade relations under the India-UK Comprehensive Economic and Trade Agreement.
    June 18, 2026
    Show AI Summary
    Money laundering probe over alleged sham payments and loans, with proceedings under the Prevention of Money Laundering Act.
    The Enforcement Directorate's money-laundering investigation concerns alleged transactions between Cochin Minerals and Rutile Ltd., Exalogic, and associated entities, including payments said to have been made without corresponding services and loans allegedly extended despite non-repayment. The agency alleges that these transactions generated proceeds of crime and has registered a case under the Prevention of Money Laundering Act on the basis of a prosecution complaint filed by the Serious Fraud Investigation Office.
    June 18, 2026
    Show AI Summary
    Social security exemption for temporary India-UK assignees will cut duplicate contributions and support skilled worker mobility.
    The India-UK Double Contribution Convention will exempt employees temporarily transferred between the two countries from host-country social security contributions for up to five years, subject to a certificate of coverage. The arrangement is reciprocal for eligible UK nationals working in India and is intended to preserve home-country social security coverage during temporary overseas assignments while reducing duplicate contribution burdens on workers and employers.
    June 18, 2026
    Show AI Summary
    Public offer classification of OFCD issuances and employee liability remain under challenge before the Supreme Court.
    Securities law issues concerning the issuance of optionally fully convertible debentures (OFCDs) by Sahara India Commercial Corporation Ltd. are under challenge, with SEBI contesting a part of the Securities Appellate Tribunal's relief granted to four managers and the company secretary. The tribunal had treated the OFCD issuances as a public offer within SEBI's regulatory jurisdiction, while also distinguishing the position of employees from that of the directors who had authorised the prospectus and remained responsible as principals for acts done through their agent. SEBI has now challenged this limited relief before the Supreme Court.
    June 18, 2026
    Show AI Summary
    Gold import duty hike drives sharp fall in volumes as foreign exchange conservation becomes policy priority.
    Gold imports in India declined sharply in volume terms after the customs duty on gold and silver was raised from 6 per cent to 15 per cent. Imports reportedly fell to about 25-30 tonnes in a month from earlier levels of 75-100 tonnes, while higher global prices kept import values elevated. The duty increase is presented as part of a broader policy response aimed at curbing gold purchases and conserving foreign exchange for essential imports.
    June 18, 2026
    Show AI Summary
    Money laundering probe over forged organ donation racket focuses on intermediaries, hospital transactions, and verification bypasses.
    Enforcement Directorate searches were conducted at hospitals and residences across Kerala in a money laundering probe linked to an alleged racket facilitating illegal organ donations through forged documents. The investigation was based on multiple police FIRs, with preliminary material indicating that intermediaries arranged donations between donors, recipients and hospitals for substantial sums. Investigators were examining bank transactions and medical records connected with the alleged organ donation arrangements. Police enquiries also indicate that the accused forged hospital letterheads, police clearance certificates and recommendation letters to bypass verification and clearance requirements.
    June 18, 2026
    Show AI Summary
    Trade and social security framework expands duty-free access, services mobility, and temporary worker contribution relief.
    India and the United Kingdom will bring CETA and the Agreement on Social Security into force on 15 July 2026, creating a broad trade and mobility framework covering goods, services, digital trade, telecommunications, financial services, intellectual property, government procurement, innovation, SMEs, sustainability and transparency. CETA provides immediate duty-free access for nearly 99% of India's exports to the UK, expands services market access across 137 sub-sectors, and preserves protection for sensitive Indian sectors. The Social Security Agreement exempts temporary workers from dual contributions and extends the exemption period from 3 years to 5 years.
    June 18, 2026
    Show AI Summary
    Trade agreement talks advance as India and the United States push for a balanced, commercially meaningful pact.
    Trade negotiations between India and the United States were advanced through a directive by the two leaders to their officials to work towards a balanced, mutually beneficial and commercially meaningful interim bilateral trade agreement at the earliest. The talks were described as having made significant progress, with further negotiations already underway and a visiting trade representative expected to take them forward. Both sides also reaffirmed commitment to strengthen the India-US Comprehensive Global Strategic Partnership and expand cooperation across defence, strategic technologies, energy and bilateral trade.
    June 18, 2026
    Show AI Summary
    Foreign interference in elections fuels Brazil-US tensions amid tariff disputes, sanctions, and criticism of drug-cartel designations.
    Brazilian President Luiz Inacio Lula da Silva warned against foreign interference in Brazil's October presidential election after remarks by the US President and renewed criticism linked to judicial action involving Lula's political rivals. The dispute reflects escalating tensions between Brazil and the United States over Brazil's domestic politics, including US sanctions against a Brazilian Supreme Court Justice and public comments about the Bolsonaro family. The article also notes proposed additional tariffs on Brazilian imports and Lula's criticism of the US designation of two Brazilian drug-trafficking groups as foreign terrorist organizations.
    June 18, 2026
    Show AI Summary
    Phased customs duty cuts and quota limits govern UK passenger car imports under the India-UK trade pact.
    India-UK trade pact provides phased reduction of customs duty on passenger vehicle imports from the UK, with quota-based access across specified engine-capacity and price bands. Conventional-engine passenger cars receive concessional treatment over 15 years, while electric, hybrid and hydrogen passenger cars are covered only from later years under limited quotas and reduced duties. Vehicles priced below GBP 40,000 CIF are excluded from market opening, and zero-emission two-wheelers, buses and trucks are excluded from any preferential customs duty concession.
    June 17, 2026
    Show AI Summary
    Offer for sale structure drives National Stock Exchange's long-delayed public listing filing after regulatory hurdles ease.
    National Stock Exchange filed preliminary papers for a proposed initial public offering structured entirely as an offer for sale by existing shareholders. The filing follows board approval and a no-objection certificate, after years of delay caused by regulatory concerns, including the co-location controversy and governance lapses. The exchange later made further compliance representations, appointed merchant bankers and other advisers, and pursued settlement in the unfair market access matter, with in-principle approval of that settlement described as removing a key obstacle to the proposed listing.
    June 17, 2026
    Show AI Summary
    Social security exemption for Indian workers in the UK extends to five years under the trade pact.
    Social security arrangements under the India-UK trade pact provide a temporary exemption from dual social security contributions for Indian workers and employers in the United Kingdom during overseas assignments. The exemption period is extended from three years to five years, applying to employees seconded from India to support UK operations. The arrangement is intended to preserve continued social security coverage during temporary postings and to facilitate labour mobility between the two countries.
    June 17, 2026
    Show AI Summary
    Steel trade safeguards shape India-UK CETA implementation as quota limits and tariff rules are adjusted for exporters.
    India-UK CETA is set to enter into force from 15 July 2026, with steel trade arrangements designed to keep a substantial share of India's exports outside the UK's safeguard measures. India's interests are said to be protected through country-specific quota, residual quota and access under the Authorised Use Scheme, while the UK's new steel regime will limit tariff-free imports, reduce quota volumes and impose a higher tariff on imports above the permitted levels. The article also notes the UK's planned carbon border adjustment mechanism from 2027.

    News

    Back

    All News

    Showing Results for :
    Reset Filters
      No Records Found

      News

      Back

      All News

      whatsappJoin Channel
      Showing Results for : Reset Filters

      PRESS RELEASE ON NEW SERIES OF WHOLESALE PRICE INDEX, AND PRODUCER PRICE INDICES WITH BASE YEAR 2022-23

      June 16, 2026

      Contents
      Summary
      Note

      Note

      -

      Bookmark

      Print

      Print

      The Office of Economic Adviser, DPIIT is releasing the revised series of WPI with base year 2022-23. The new series will replace the existing series of WPI with base year 2011-12. In addition, the Office is also releasing new series of Output Producer Price Index (OPPI), Trial Input Producer Price Index (IPPI), and Service Producer Price Index (Service PPI) of seven services, viz., Banking, Securities Transaction, Insurance, Management of Pension Funds, Railways, Air (Passenger), and Telecom with the same base year.

      Considering the wide usage of WPI in price escalation clauses, this index will be released for five years from the date of its release, along with PPI, and will be discontinued thereafter. This would give sufficient time to users to switch from WPI to PPI. The transition from WPI to PPI is in alignment with the global best practices adopted by advanced economies and the recommendations of the International Monetary Fund (IMF). Availability of both the Output PPI and Input PPI gives a better understanding of the price movements of output produced vis-a-vis inputs being used in an industry. It also explains how inflation experienced by producers on inputs are passed on to the output being produced.

      Service PPIs for seven services have been compiled in the first phase based on the availability of data from administrative sources/agencies.

      WPI, and Output PPI, being compiled on a monthly basis, are being released for the month of May 2026 (Provisional Estimates). The back series of these indices are placed on the web portal of the Office of the Economic Adviser at weblink (https://eaindustry.nic.in/download_data_2223.asp). The monthly Trial Input PPI (only for Manufacturing Sector) is being published on an experimental basis March 2026 onwards. The publication of Trial Input PPI would enable the Department to examine the data quality and also receive feedback of stakeholders and users.

      Service PPIs, compiled on a quarterly basis, are being released for Q4 of 2025-26 (Provisional). The back series of Service PPIs is placed on the web portal of the Office of the Economic Adviser at weblink (https://eaindustry.nic.in/download_data_2223.asp).

      Key features of the new WPI series (Base Year 2022-23):

      1. Increased number of Items: The total number of items have increased from 697 to 957.
      2. Inclusion of New and Renewable Energy under Electricity: New sources of energy, such as Solar and Wind, have been added under ‘Electricity’ Group. In addition, Nuclear Electricity has been included in the basket.
      3. Coherent and Integrated Structure for Tracking Energy Prices: Crude Petroleum and Natural Gas has been shifted from ‘Primary Articles’ to ‘Fuel and Power’ major group. This reorganization has been done to ensure better alignment, as this group already houses other major fuels such as coal, electricity, and petroleum products.
      4. Improved Methodology for Derivation of Weights: Gross Value of Output (GVO) has been used for preparing weights for WPI 2022-23 series, compared to Net Traded Value i.e. GVO + Imports – Exports, used in WPI 2011-12 series. Weights derived on the basis of GVO represent the economic significance of commodities more accurately, as they reflect domestic production than the trade flows.
      5. Improved Computation Methodology: The elementary indices have been compiled using short-term formulation method, in place of long-term formulation method used in WPI 2011-12 series.
      6. Improved Method for Imputing Missing Price Data: In case of non-response or missing data, ‘Targeted Mean Imputation’ method has been used to impute missing prices in WPI 2022-23 series, compared to the ‘Carry Forward’ method followed in WPI 2011-12 series.
      7. Linking Factor: The Linking Factor has been computed as ratio of geometric means of the twelve-month indices of old and new series of WPI for the financial year 2024-25. At lower levels of disaggregation, the composition of the item basket has undergone significant changes, owing to the inclusion of new items and the removal of obsolete ones. Consequently, the derivation of linking factors at such granular levels may not yield reliable results. Linking Factor for linking 2011-12 series with 2022-23 series is given below: -

      Major Group

      Linking Factor

      All Commodities

      1.53

      Primary Articles

      1.71

      Fuel and Power

      1.65

      Manufactured Products

      1.44

      While linking factors for All Commodities and Major Groups have been provided for reference, users are advised to exercise due caution while interpreting and comparing the indices across the two series. It may also be noted that, as a matter of policy, the Office of the Economic Adviser, DPIIT does not prescribe any specific methodology for linking or converting indices from one series to another. The selection of an appropriate linking approach is left to the discretion of users, depending on their analytical requirements and purposes.

      Producer Price Indices (PPIs)

      The weights for Output PPI and trial Input PPI have been derived using the Supply Table and Use Table respectively of Supply & Use Table (SUT) of National Accounts for the year 2022-23.

      WPI, Output PPI and Service PPI are being compiled on the basis of Basic Price (which excludes Net Tax and Trade & Transport Margin), whereas trial Input PPI is being compiled using Purchaser’s Price since industries purchase input from market.

      Release Schedule

      Provisional indices of WPI, OPPI, and trial IPPI for a reference month will be released on the 14th of the following month (if it is a working day, else on next working day). Since new WPI series (Base Year 2022-23) is being released, index for old series (Base Year 2011-12) will be discontinued. Service PPIs for seven services will be released on a quarterly basis with a lag of 55 days from the closure of the reference quarter (if it is a working day, else on next working day).

      Accordingly, release of WPI, Output PPI, and trial Input PPI for the month of June 2026 will be on Tuesday, 14th July 2026.

      Service PPIs for seven services for Q1 of FY 2026-27 will be released on Monday, 24th August 2026.

      For details pertaining to WPI, Output PPI, trial IPPI, and, Service PPIs, this press release is structured into four parts: -

      Part A

      Provisional Estimates of Wholesale Price Index (Base Year 2022-23) for the month of May 2026

      Part B

      Provisional Estimates of Output Producer Price Index (Base Year 2022-23) for the month of May 2026

      Part C

      1. Provisional Estimates of Trial Input Producer Price Index (Base Year 2022-23) for the month of May 2026

      Part D

      Provisional Estimates of Service Producer Price Indices for Q4 of FY 2025-26

      Part A-Provisional Estimates of Wholesale Price Index (Base Year 2022-23) for the Month of May 2026

      Part A-Provisional Estimates of Wholesale Price Index (Base Year 2022-23) for the Month of May 2026

      1. Key highlights of WPI (Base Year 2022-23) for May 2026
      1. All India Wholesale Price Index (WPI) inflation for May 2026 is 9.68 per cent on year-on-year (YoY) basis, compared to 8.26 per cent in April 2026. The index for All Commodities for May 2026 stands at 109.9, whereas it was 108.8 in April 2026.
      2. Across Major Groups, YoY inflation for Primary Articles, Fuel and Power, and Manufactured Products is 4.99 per cent, 30.33 per cent, and 7.48 per cent, respectively in May 2026, whereas it was 3.78 per cent, 24.89 per cent, and 6.68 per cent, respectively, in April 2026. The indices for Primary Articles, Fuel and Power, and Manufactured Products are 113.7, 113, and 107.8, respectively, in May 2026, whereas they were 112.6, 110.9, and 107, respectively, in April 2026.
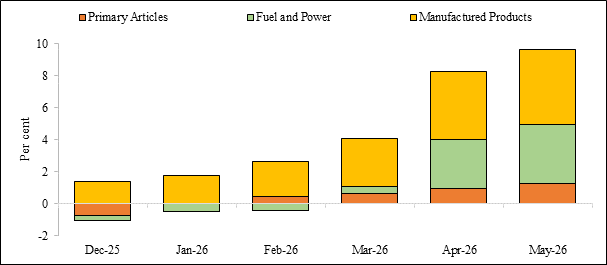
      3. Across Groups, ‘Mineral Oils (containing Petroleum Products)’, ‘Crude Petroleum and Natural Gas’, ‘Manufacture of Chemicals and Chemical Products’, and ‘Manufacture of Basic Metals’, have been major drivers of WPI inflation in April and May 2026.
      4. WPI Food Index (weight=24.99 per cent): The Food Index consists of ‘Food Articles’ from Primary Articles major group, and ‘Manufacture of Food Products’ from Manufactured Products major group. It observed a YoY inflation of 4.49 per cent in May 2026, compared to 3.11 per cent in April 2026.
      5. Monthly indices and Inflation Rate (in per cent) for All commodities and Major Groups, along with major group-wise contribution for the past months are presented in the charts below.

      Chart 1: WPI Index and Inflation Rate for All Commodities
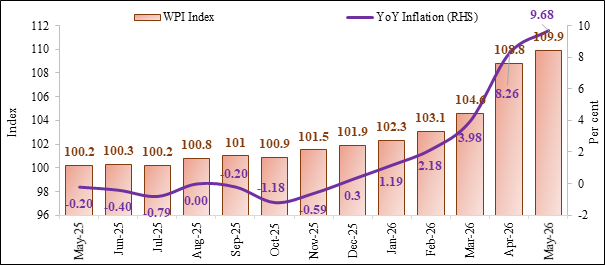
      Chart 2: WPI Index of Major Groups
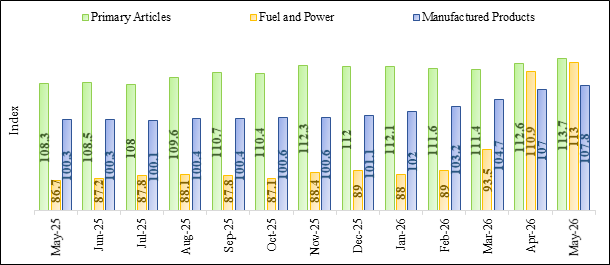
      Chart 3: Inflation Rate across Major Groups
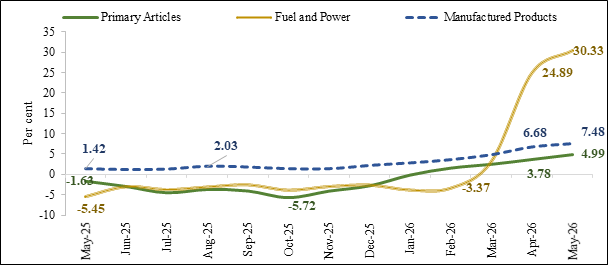
      Chart 4: Major Group-Wise contribution to Inflation
      1. The Final Estimate of WPI (Base Year 2022-23) for the month of March 2026 has been compiled with a weighted response rate of 97.02 per cent.
      2. The Provisional Estimate of WPI (Base Year 2022-23) for the month of May 2026 has been compiled with a weighted response rate of 84.4 per cent.
      3. Wholesale Price Index, and Year-on-Year (YoY) Inflation Rate for All Commodities, Major Groups, and Groups for the last six months is given at Annexure-I and II.
      4. Annual WPI for All Commodities, Major Groups, and Groups for FY 2023-24, FY 2024-25, and FY 2025-26 are given at Annexure-III.
      5. YoY Inflation Rate for All Commodities, Major Groups, and Groups for FY 2024-25, and FY 2025-26 are given at Annexure- IV.
      6. Item-wise data pertaining to WPI (Base Year 2022-23) series from April 2023 to May 2026 is available at (https://eaindustry.nic.in/download_data_2223.asp).

            Annexure-I

      WPI for All Commodities, Major Groups and Groups for last six months

      Groups/Major Groups

      Weight

      Dec-25 (F)

      Jan-26 (F)

      Feb-26 (F)

      Mar-26 (F)

      Apr-26 (P)

      May-26 (P)

      All Commodities

      100.00000

      101.9

      102.3

      103.1

      104.6

      108.8

      109.9

      I. Primary Articles

      22.75730

      112.0

      112.1

      111.6

      111.4

      112.6

      113.7

      (A). Food Articles

      15.97835

      114.5

      113.9

      113.1

      112.8

      114.0

      115.0

      (B). Non-Food Articles

      5.52841

      105.1

      107

      107.3

      107.4

      107.6

      108.4

      (C). Minerals

      1.25054

      111.4

      111.1

      112

      110.8

      117

      119.7

      II. Fuel and Power

      14.11433

      89.0

      88.0

      89.0

      93.5

      110.9

      113.0

      (A). Coal and Lignite

      0.74136

      86.7

      86.2

      86.5

      87.8

      87.7

      86.6

      (B). Mineral Oils

      8.19208

      86.0

      84.6

      85.8

      92.9

      121.6

      125.7

      (C). Electricity

      4.46349

      95.6

      94.5

      94.7

      91.2

      90.7

      90.3

      (D). Crude Petroleum & Natural Gas

      0.71740

      85.5

      88.7

      92.4

      119.7

      138.8

      136.8

      III. MANUFACTURED PRODUCTS

      63.12837

      101.1

      102.0

      103.2

      104.7

      107.0

      107.8

      (A). Manufacture of Food Products

      9.02016

      106.7

      107.0

      108.0

      109.1

      110.8

      112.3

      (B). Manufacture of Beverages

      0.90483

      102.5

      102.9

      102.6

      102.7

      104.5

      105.3

      (C). Manufacture of Tobacco Products

      0.27645

      110.8

      110.6

      122.7

      122.6

      124.2

      123.7

      (D). Manufacture of Textiles

      4.08993

      92.4

      93.3

      94.4

      96.4

      99.0

      101.4

      (E). Manufacture of Wearing Apparel

      1.32948

      110.4

      109.9

      109.8

      109.9

      110.8

      112.2

      (F). Manufacture of Leather and Related Products

      0.54137

      104.0

      104.3

      104.9

      105.5

      107.3

      108.5

      (G). Manufacture Of Wood and Products of Wood and Cork, except Furniture; Manufacture of Articles of Straw and Plaiting Materials

      1.07718

      109.3

      109.9

      110.0

      112.1

      114.8

      116.1

      (H). Manufacture of Paper and Paper Products

      1.15328

      89.9

      90.1

      90.6

      91.4

      93.6

      93.9

      (I). Printing and Reproduction of Recorded Media

      0.42618

      104.7

      104.8

      105.1

      105.8

      106.9

      108.3

      (J). Manufacture of Chemicals and Chemical Products

      6.12567

      90.4

      91.0

      91.8

      96.5

      101.9

      102.4

      (K). Manufacture of Basic Pharmaceutical Products and Pharmaceutical Preparations 

      2.20102

      99.9

      99.6

      99.6

      100.8

      102.0

      102.3

      (L). Manufacture of Rubber and Plastic Products

      2.71467

      95.3

      95.5

      96.3

      101.9

      105.2

      105.1

      (M). Manufacture of Other Non-Metallic Mineral Products

      2.84074

      96.1

      96.3

      96.1

      96.8

      98.5

      98.9

      (N). Manufacture of Basic Metals

      8.41133

      91.8

      95.2

      98.0

      100.1

      103.4

      104.1

      (O). Manufacture of Fabricated Metal Products, except Machinery and Equipment

      4.13294

      100.1

      100.9

      102.0

      102.7

      104.5

      105.8

      (P). Manufacture of Computer, Electronic and Optical Products

      2.07628

      101.1

      101.2

      101.5

      102.0

      102.5

      103.4

      (Q). Manufacture of Electrical Equipment

      2.64318

      107.1

      108.5

      110.2

      111.0

      112.6

      114.1

      (R). Manufacture of Machinery and Equipment n.e.c.

      3.46796

      103.8

      103.9

      104.3

      104.3

      105.0

      105.4

      (S). Manufacture of Motor Vehicles, Trailers and Semi-Trailers

      5.43645

      105.5

      105.9

      106.4

      105.9

      108.3

      108.5

      (T). Manufacture of Other Transport Equipment

      1.39511

      105.2

      105.1

      105.2

      105.4

      106.2

      106.6

      (U). Manufacture of Furniture

      0.82618

      101.8

      102.0

      102.6

      102.8

      105.4

      106.1

      (V). Other Manufacturing

      2.03798

      147.7

      152.4

      156.4

      158.8

      158.7

      158.8

      Food Index

      24.99851

      111.7

      111.4

      111.3

      111.5

      112.8

      114.0

      (P)-Provisional, (F)-Final

        Annexure-II

            WPI Inflation Rate (YoY) for All Commodities, Major Groups, and Groups for last six months

      Groups/Major Groups

      Weight

      Dec-25 (F)

      Jan-26 (F)

      Feb-26 (F)

      Mar-26 (F)

      Apr-26 (P)

      May-26 (P)

      All Commodities

      100.00000

      0.30

      1.19

      2.18

      3.98

      8.26

      9.68

      I. Primary Articles

      22.75730

      -2.78

      -0.09

      1.64

      2.58

      3.78

      4.99

      (A). Food Articles

      15.97835

      -4.42

      -1.30

      0.80

      1.53

      2.43

      3.60

      (B). Non-Food Articles

      5.52841

      2.74

      3.98

      4.68

      6.65

      7.6

      9.49

      (C). Minerals

      1.25054

      -1.68

      -0.45

      1.36

      0.09

      6.36

      4.91

      II. Fuel and Power

      14.11433

      -2.63

      -3.83

      -3.37

      3.20

      24.89

      30.33

      (A). Coal and Lignite

      0.74136

      -3.13

      -3.90

      -2.37

      -0.79

      -1.57

      -2.26

      (B). Mineral Oils

      8.19208

      -1.94

      -4.19

      -4.35

      4.26

      40.74

      49.82

      (C). Electricity

      4.46349

      -2.75

      -2.28

      -1.56

      -2.04

      -2.68

      -1.85

      (D). Crude Petroleum & Natural Gas

      0.71740

      -8.26

      -9.95

      -5.33

      26.13

      56.31

      61.51

      III. Manufactured Products

      63.12837

      2.22

      2.82

      3.61

      4.80

      6.68

      7.48

      (A). Manufacture of Food Products

      9.02016

      1.14

      1.61

      2.08

      2.54

      4.53

      6.14

      (B). Manufacture of Beverages

      0.90483

      -1.63

      -1.06

      -0.68

      -0.68

      0.48

      1.64

      (C). Manufacture of Tobacco Products

      0.27645

      2.50

      2.03

      12.57

      11.86

      13.63

      13.59

      (D). Manufacture of Textiles

      4.08993

      0

      0.97

      1.94

      4.90

      7.14

      10.22

      (E). Manufacture of Wearing Apparel

      1.32948

      3.95

      3.78

      3.39

      2.90

      2.88

      4.28

      (F). Manufacture of Leather and Related Products

      0.54137

      2.36

      2.05

      2.64

      3.23

      3.87

      4.33

      (G). Manufacture of Wood and Products of Wood and

      Cork, except Furniture; Manufacture of Articles of Straw and Plaiting Materials

      1.07718

      3.60

      3.10

      3.00

      5.06

      7.69

      7.60

      (H). Manufacture of Paper and Paper Products

      1.15328

      -0.11

      -0.88

      -0.66

      0.11

      2.07

      2.74

      (I). Printing and Reproduction of Recorded Media

      0.42618

      0.96

      1.16

      1.55

      2.12

      2.99

      4.13

      (J). Manufacture of Chemicals and Chemical Products

      6.12567

      -0.44

      -0.33

      0.22

      5.70

      12.22

      13.40

      (K). Manufacture of Basic Pharmaceutical Products

      and Pharmaceutical Preparations 

      2.20102

      0

      0.10

      0.30

      1.10

      2.31

      3.33

      (L). Manufacture of Rubber and Plastic Products

      2.71467

      -1.35

      -1.24

      -0.72

      5.38

      9.24

      9.59

      (M). Manufacture of Other Non-Metallic Mineral Products

      2.84074

      -0.31

      -0.31

      -0.93

      -0.10

      1.23

      1.02

      (N). Manufacture of Basic Metals

      8.41133

      1.44

      5.19

      7.34

      8.57

      10.59

      12.30

      (O). Manufacture of Fabricated Metal Products, except

      Machinery and Equipment

      4.13294

      1.52

      2.54

      2.82

      3.42

      5.13

      6.22

      (P). Manufacture of Computer, Electronic and Optical Products

      2.07628

      4.23

      1.30

      0.89

      -0.58

      -0.39

      -0.19

      (Q). Manufacture of Electrical Equipment

      2.64318

      4.79

      6.69

      7.62

      7.98

      9.11

      11.32

      (R). Manufacture of Machinery and Equipment n.e.c.

      3.46796

      1.07

      0.78

      1.26

      1.07

      1.74

      2.33

      (S). Manufacture of Motor Vehicles, Trailers and Semi-Trailers

      5.43645

      0.86

      0.38

      1.82

      0.95

      2.36

      2.17

      (T). Manufacture of Other Transport Equipment

      1.39511

      2.94

      2.34

      1.74

      1.93

      3.41

      4.31

      (U). Manufacture of Furniture

      0.82618

      -0.59

      -0.58

      -0.10

      0.19

      3.64

      5.68

      (V). Other Manufacturing

      2.03798

      33.06

      32.52

      31.54

      32.89

      27.57

      21.87

      Food Index

      24.99851

      -2.53

      -0.36

      1.27

      1.92

      3.11

      4.49

      (P)-Provisional, (F)-Final

      Annexure-III

       Annual WPI for All Commodities, Major Groups, and Groups

      Groups/Major Groups

      Weight

      2023-24

      2024-25

      2025-26

      All Commodities

      100.00000

      99.3

      101.0

      101.4

      I. Primary Articles

      22.75730

      106.4

      112.8

      110.3

      (A). Food Articles

      15.97835

      108.9

      117.1

      112.8

      (B). Non-Food Articles

      5.52841

      99.8

      100.1

      102.5

      (C). Minerals

      1.25054

      103.7

      113.0

      112.4

      II. Fuel and Power

      14.11433

      93.0

      91.1

      88.5

      (A). Coal and Lignite

      0.74136

      92.1

      89.8

      87.9

      (B). Mineral Oils

      8.19208

      91.1

      88.8

      85.9

      (C). Electricity

      4.46349

      95.8

      94.4

      92.8

      (D). Crude Petroleum & Natural Gas

      0.71740

      98.3

      97.5

      91

      III. Manufactured Products

      63.12837

      98.1

      99.0

      101.2

      (A). Manufacture of Food Products

      9.02016

      98.7

      103.5

      106.8

      (B). Manufacture of Beverages

      0.90483

      102.7

      103.8

      103.4

      (C). Manufacture of Tobacco Products

      0.27645

      104.9

      107.6

      112.2

      (D). Manufacture of Textiles

      4.08993

      92.2

      92.5

      92.9

      (E). Manufacture of Wearing Apparel

      1.32948

      102.7

      105.5

      109.2

      (F). Manufacture of Leather and Related Products

      0.54137

      101.3

      102.1

      104.4

      (G). Manufacture of Wood and Products of Wood and Cork, except Furniture; Manufacture of Articles of Straw and Plaiting Materials

      1.07718

      102.8

      104.7

      108.9

      (H). Manufacture of Paper and Paper Products

      1.15328

      89.5

      90.4

      90.9

      (I). Printing and Reproduction of Recorded Media

      0.42618

      103.8

      104.2

      104.8

      (J). Manufacture of Chemicals and Chemical Products

      6.12567

      92.1

      91.2

      91.3

      (K). Manufacture of Basic Pharmaceutical Products and Pharmaceutical Preparations 

      2.20102

      101.0

      99.7

      99.7

      (L). Manufacture of Rubber and Plastic Products

      2.71467

      94.8

      96.5

      96.5

      (M). Manufacture of Other Non-Metallic Mineral Products

      2.84074

      99.2

      96.0

      96.9

      (N). Manufacture of Basic Metals

      8.41133

      93.5

      92.2

      93.2

      (O). Manufacture of Fabricated Metal Products, except Machinery and Equipment

      4.13294

      99.9

      99.3

      100.2

      (P). Manufacture of Computer, Electronic and Optical Products

      2.07628

      97.6

      98.2

      102.3

      (Q). Manufacture of Electrical Equipment

      2.64318

      100.5

      102.2

      105.9

      (R). Manufacture of Machinery and Equipment n.e.c.

      3.46796

      102.0

      102.6

      103.6

      (S). Manufacture of Motor Vehicles, Trailers and Semi-Trailers

      5.43645

      104.7

      105.5

      105.7

      (T). Manufacture of Other Transport Equipment

      1.39511

      101.7

      101.8

      104.1

      (U). Manufacture of Furniture

      0.82618

      101.3

      102.1

      101.4

      (V). Other Manufacturing

      2.03798

      105.5

      113.1

      138.2

      Food Index

      24.99851

      105.2

      112.2

      110.6

      Note: Annual Index has been calculated by taking Arithmetic Mean of 12 months indices

      Annexure-IV

       Annual WPI Inflation Rate (YoY) for All Commodities, Major Groups, and Groups

      Groups/Major Groups

      Weight

      2024-25

      2025-26

      All Commodities

      100.00000

      1.74

      0.40

      I. Primary Articles

      22.75730

      5.93

      -2.19

      (A). Food Articles

      15.97835

      7.51

      -3.67

      (B). Non-Food Articles

      5.52841

      0.27

      2.41

      (C). Minerals

      1.25054

      9.03

      -0.60

      II. Fuel and Power

      14.11433

      -2.05

      -2.90

      (A). Coal and Lignite

      0.74136

      -2.58

      -2.10

      (B). Mineral Oils

      8.19208

      -2.51

      -3.28

      (C). Electricity

      4.46349

      -1.41

      -1.70

      (D). Crude Petroleum & Natural Gas

      0.71740

      -0.76

      -6.71

      III. Manufactured Products

      63.12837

      0.90

      2.16

      (A). Manufacture of Food Products

      9.02016

      4.86

      3.22

      (B). Manufacture of Beverages

      0.90483

      1.11

      -0.42

      (C). Manufacture of Tobacco Products

      0.27645

      2.58

      4.27

      (D). Manufacture of Textiles

      4.08993

      0.33

      0.47

      (E). Manufacture of Wearing Apparel

      1.32948

      2.79

      3.46

      (F). Manufacture of Leather and Related Products

      0.54137

      0.73

      2.29

      (G). Manufacture of Wood and Products of Wood and Cork, except Furniture; Manufacture of Articles of Straw and Plaiting Materials

      1.07718

      1.92

      3.95

      (H). Manufacture of Paper and Paper Products

      1.15328

      1.02

      0.55

      (I). Printing and Reproduction of Recorded Media

      0.42618

      0.37

      0.58

      (J). Manufacture of Chemicals and Chemical Products

      6.12567

      -1.06

      0.12

      (K). Manufacture of Basic Pharmaceutical Products and Pharmaceutical Preparations 

      2.20102

      -1.24

      -0.03

      (L). Manufacture of Rubber and Plastic Products

      2.71467

      1.78

      0.00

      (M). Manufacture of Other Non-Metallic Mineral Products

      2.84074

      -3.19

      0.86

      (N). Manufacture of Basic Metals

      8.41133

      -1.34

      1.01

      (O). Manufacture of Fabricated Metal Products, except Machinery and Equipment

      4.13294

      -0.54

      0.91

      (P). Manufacture of Computer, Electronic and Optical Products

      2.07628

      0.61

      4.11

      (Q). Manufacture of Electrical Equipment

      2.64318

      1.72

      3.64

      (R). Manufacture of Machinery and Equipment n.e.c.

      3.46796

      0.60

      0.98

      (S). Manufacture of Motor Vehicles, Trailers and Semi-Trailers

      5.43645

      0.72

      0.21

      (T). Manufacture of Other Transport Equipment

      1.39511

      0.08

      2.25

      (U). Manufacture of Furniture

      0.82618

      0.77

      -0.72

      (V). Other Manufacturing

      2.03798

      7.16

      22.22

      Food Index

      24.99851

      6.62

      -1.37


      Part B-Provisional Estimates of Output Producer Price Index (Base Year 2022-23) for the month of May 2026

      Part B-Provisional Estimates of Output Producer Price Index (Base Year 2022-23) for the month of May 2026

      1. Key highlights of OPPI (Base Year 2022-23) for May 2026
      1. All India Output PPI for All Commodities for May 2026 stands at 109.6, whereas it was 108.6 in April 2026.
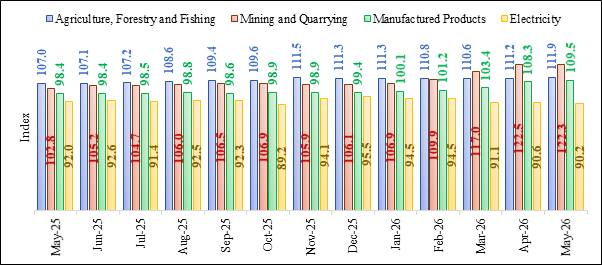
      2. Across Major Groups, indices for Agriculture, Forestry and Fishing; Mining and Quarrying; Manufactured Products; and Electricity are 111.9, 122.3, 109.5, and 90.2, respectively, in May 2026, whereas they were 111.2, 122.5, 108.3, and, 90.6 respectively, in April 2026.
      3. Monthly indices for All Commodities and Major Groups, for the past 13 months are presented in the charts below.

      Chart 5: Output PPI for All Commodities
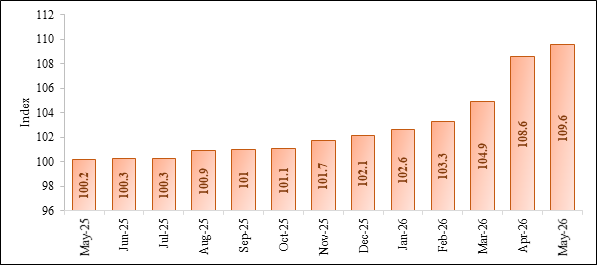
      Chart 6: Output PPI across Major Groups
      1. Output PPI for All Commodities, Major Groups, and Groups for the last six months is given at Annexure-V.
      2. Annual Output PPI for All Commodities, Major Groups, and Groups for FY 2023-24, FY 2024-25, and FY 2025-26 is given at Annexure-VI.
      3. SUT category-wise index pertaining to Output PPI (Base Year 2022-23) series from April 2023 to May 2026 is available at (https://eaindustry.nic.in/download_data_2223.asp).

      Annexure-V

      Output PPI for All Commodities, Major Groups and Groups for last six months

      Groups/Major Groups

      Weight

      Dec-25 (F)

      Jan-26 (F)

      Feb-26 (F)

      Mar-26 (F)

      Apr-26 (P)

      May-26 (P)

      ALL COMMODITIES

      100.00000

      102.1

      102.6

      103.3

      104.9

      108.6

      109.6

      AGRICULTURE, FORESTRY AND FISHING

      22.15648

      111.3

      111.3

      110.8

      110.6

      111.2

      111.9

      Crop and Animal Production, Hunting and Related Service Activities 

      19.03219

      111.9

      111.7

      111.3

      111

      111.3

      111.8

      Forestry and Logging

      1.67481

      114.6

      114.4

      115

      115.4

      116.7

      117.2

      Fishing and Aquaculture

      1.44948

      99.0

      102.7

      99.3

      100.1

      103.2

      106.9

      MINING AND QUARRYING

      3.42065

      106.1

      106.9

      109.9

      117

      122.5

      122.3

      Mining of Metal Ores

      0.70792

      153.4

      158.6

      168

      171.5

      169.6

      174.8

      Mining of Coal and Lignite

      0.73980

      86.7

      86.2

      86.5

      87.8

      87.7

      86.6

      Other Mining and Quarrying

      1.23208

      106.2

      103.2

      103.2

      100.5

      105.1

      105.2

      Extraction of Crude Petroleum and Natural Gas

      0.74085

      80.2

      84.5

      88.9

      121.7

      141

      136.2

      MANUFACTURED PRODUCTS

      69.93568

      99.4

      100.1

      101.2

      103.4

      108.3

      109.5

      (A). Manufacture of Food Products

      8.47196

      107.1

      107.5

      108.3

      109.2

      110.8

      112.2

      (B). Manufacture of Beverages

      0.84170

      102.7

      103.1

      102.7

      102.8

      104.6

      105.5

      (C). Manufacture of Tobacco Products

      0.25705

      112.0

      111.9

      125.9

      125.9

      127.0

      126.7

      (D). Manufacture of Textiles

      4.38774

      92.9

      93.7

      95.0

      97.8

      100.9

      103.1

      (E). Manufacture of Wearing Apparel

      1.20494

      109.4

      108.8

      108.7

      108.7

      109.6

      111.2

      (F). Manufacture of Leather and Related Products

      0.49989

      103.2

      103.1

      103.6

      104.2

      106.1

      107.2

      (G). Manufacture of Wood and Products of Wood and Cork, except Furniture; Manufacture of Articles of Straw and Plaiting Materials

      1.08949

      107.6

      108.1

      108.3

      110.3

      113.0

      114.4

      (H). Manufacture of Paper and Paper Products

      1.03128

      90.2

      90.3

      90.7

      91.6

      93.8

      94.1

      (I). Printing and Reproduction of Recorded Media

      0.30931

      105.7

      105.6

      106.1

      107.1

      108.1

      109.4

      (J). Manufacture of Coke and Refined Petroleum Products

      7.14818

      85.9

      84.5

      85.7

      92.7

      121

      125.1

      (K). Manufacture of Chemicals and Chemical Products

      5.74793

      90.7

      91.5

      92.2

      97.3

      102.6

      102.7

      (L). Manufacture of Basic Pharmaceuticals, Medicinal Chemical and Botanical Products

      1.92807

      100.8

      100.7

      100.6

      101.8

      102.9

      103.1

      (M). Manufacture of Rubber and Plastic Products

      2.57252

      95.7

      95.9

      96.9

      102.5

      105.8

      105.7

      (N). Manufacture of Other Non-Metallic Mineral Products

      2.50437

      95.6

      96.0

      95.8

      96.4

      98.4

      98.7

      (O). Manufacture of Basic Metals

      7.46500

      90.8

      94.3

      96.6

      99.0

      103.1

      103.9

      (P). Manufacture of Fabricated Metal Products, except Machinery and Equipment

      3.15198

      98.5

      99.3

      100.4

      101.1

      102.5

      103.6

      (Q). Manufacture of Computer, Electronic and Optical Products

      1.77480

      103.9

      104.4

      104.6

      104.6

      105.0

      106.0

      (R). Manufacture of Electrical Equipment

      3.81453

      102.7

      103.1

      104.0

      104.4

      105.6

      107.1

      (S). Manufacture of Machinery and Equipment n.e.c.

      2.46158

      104.1

      104.1

      104.7

      104.8

      105.5

      105.7

      (T). Manufacture of Motor Vehicles, Trailers and Semi-Trailers

      4.39321

      105.9

      106.4

      106.9

      106.6

      108.7

      108.8

      (U). Manufacture of Other Transport Equipment

      1.34392

      105.4

      106.0

      106.1

      106.4

      107.1

      107.5

      (V). Manufacture of Furniture

      0.73566

      103.1

      102.9

      103.2

      103.7

      105.2

      105.2

      (W). Other Manufacturing

      6.80057

      114.1

      115.9

      118.3

      119.9

      121.1

      122.0

      ELECTRICITY

      4.48719

      95.5

      94.5

      94.5

      91.1

      90.6

      90.2

      Electricity

      4.48719

      95.5

      94.5

      94.5

      91.1

      90.6

      90.2

        (P)-Provisional, (F)-Final

      Annexure-VI

      Annual Output PPI for All Commodities, Major Groups and Groups

      Groups/Major Groups

      Weights

      2023-24

      2024-25

      2025-26

      ALL COMMODITIES

      100.00000

      99.2

      100.9

      101.6

      AGRICULTURE, FORESTRY AND FISHING

      22.15648

      106.3

      111.3

      109.3

      Crop and Animal Production, Hunting and Related Service Activities 

      19.03219

      106.7

      111.8

      109.7

      Forestry and Logging

      1.67481

      106.1

      114.2

      113.1

      Fishing and Aquaculture

      1.44948

      100.6

      101.3

      100.6

      MINING AND QUARRYING

      3.42065

      100.2

      105

      106.7

      Mining of Metal Ores

      0.70792

      107.5

      127.4

      151

      Mining of Coal and Lignite

      0.73980

      92.1

      89.8

      87.9

      Other Mining and Quarrying

      1.23208

      104.0

      108.5

      104.6

      Extraction of Crude Petroleum and Natural Gas

      0.74085

      94.7

      93.2

      86.7

      MANUFACTURED PRODUCTS

      69.93568

      97.2

      97.8

      99.4

      (A). Manufacture of Food Products

      8.47196

      97.8

      103.3

      107.1

      (B). Manufacture of Beverages

      0.84170

      102.8

      104.0

      103.6

      (C). Manufacture of Tobacco Products

      0.25705

      104.5

      107.6

      113.1

      (D). Manufacture of Textiles

      4.38774

      92.4

      92.7

      93.4

      (E). Manufacture of Wearing Apparel

      1.20494

      102.2

      104.7

      108.1

      (F). Manufacture of Leather and Related Products

      0.49989

      100.6

      101.3

      103.1

      (G). Manufacture of Wood and Products of Wood and Cork, except Furniture; Manufacture of Articles of Straw and Plaiting Materials

      1.08949

      102.3

      104.0

      107.5

      (H). Manufacture of Paper and Paper Products

      1.03128

      89.4

      90.5

      91.1

      (I). Printing and Reproduction of Recorded Media

      0.30931

      104.3

      104.7

      105.8

      (J). Manufacture of Coke and Refined Petroleum Products

      7.14818

      91.1

      88.8

      85.8

      (K). Manufacture of Chemical and Chemical Products

      5.74793

      92.2

      91.4

      91.7

      (L). Manufacture of Basic Pharmaceuticals, Medicinal Chemical and Botanical Products

      1.92807

      101.1

      99.3

      100.5

      (M). Manufacture of Rubber and Plastic Products

      2.57252

      94.9

      96.5

      96.8

      (N). Manufacture of Other Non-Metallic Mineral Products

      2.50437

      98.9

      95.7

      96.4

      (O). Manufacture of Basic Metals

      7.46500

      93.3

      92.1

      92.3

      (P). Manufacture of Fabricated Metal Products, except Machinery and Equipment

      3.15198

      98.4

      99.0

      98.8

      (Q). Manufacture of Computer, Electronic and Optical Products

      1.77480

      96.6

      99.2

      105.3

      (R). Manufacture of Electrical Equipment

      3.81453

      99.3

      99.7

      102.0

      (S). Manufacture of Machinery and Equipment n.e.c.

      2.46158

      102.3

      102.8

      103.9

      (T). Manufacture of Motor Vehicles, Trailers and Semi-Trailers

      4.39321

      105.1

      105.6

      106.1

      (U). Manufacture of Other Transport Equipment

      1.34392

      102.1

      102.0

      104.8

      (V). Manufacture of Furniture

      0.73566

      101.4

      101.8

      102.0

      (W). Other Manufacturing

      6.80057

      101.3

      103.3

      111.4

      ELECTRICITY

      4.48719

      95.8

      94.4

      92.7

      Electricity

      4.48719

      95.8

      94.4

      92.7

      Note: Annual Index has been calculated by taking Arithmetic Mean of 12 months indices

      Part C-Provisional Estimates of Trial Input Producer Price Index (Base Year 2022-23) for the month of May 2026

      Part C-Provisional Estimates of Trial Input Producer Price Index (IPPI) (Base Year 2022-23) for the month of May 2026

      1. All India trial Input PPI for Manufacturing Sector for May 2026 stands at 104.9.
      2. Trial Input PPI for all Manufacturing Industries at NIC-2-digit, for the months of March, April and May 2026 is given below.

      Trial Input PPI for all Manufacturing Industries at NIC-2-digit

      Industry Group

      Weight

      Mar-26 (F)

      Apr-26 (P)

      May-26 (P)

      Manufacturing Sector

      100.00000

      100.9

      104.9

      104.9

      (A). Manufacture of Food Products

      14.84638

      107.1

      108.1

      110.5

      (B). Manufacture of Beverages

      1.03035

      106.0

      104.6

      104.8

      (C). Manufacture of Tobacco Products

      0.26443

      128.0

      124.9

      125.7

      (D). Manufacture of Textiles

      5.88918

      95.5

      100.8

      103.1

      (E). Manufacture of Wearing Apparel

      1.57012

      105.6

      106.4

      108.3

      (F). Manufacture of Leather and Related Products

      0.77634

      96.3

      96.0

      96.2

      (G). Manufacture of Wood and Products of Wood and Cork, Except Furniture; Manufacture of Articles of Straw and Plaiting Materials

      1.82194

      99.7

      110.3

      110.8

      (H). Manufacture of Paper and Paper Products

      0.87494

      95.1

      96.9

      97.1

      (I). Printing and Reproduction of Recorded Media

      0.46606

      96.4

      98.2

      101.2

      (J). Manufacture of Coke and Refined Petroleum Products

      12.32910

      98.2

      112.1

      105.8

      (K). Manufacture of Chemicals and Chemical Products

      7.98919

      100.9

      107.4

      111.8

      (L). Manufacture of Basic Pharmaceutical Products and Pharmaceutical Preparations 

      2.40463

      98.2

      103.0

      104.9

      (M). Manufacture of Rubber and Plastic Products

      3.40235

      105.9

      110.4

      111.9

      (N). Manufacture of Other Non-Metallic Mineral Products

      3.28306

      92.3

      95.8

      93.2

      (O). Manufacture of Basic Metals

      11.25229

      98.3

      100.8

      98.5

      (P). Manufacture of Fabricated Metal Products, except Machinery and Equipment

      5.59239

      99.7

      101.5

      103.9

      (Q). Manufacture of Computer, Electronic and Optical Products

      2.22964

      108.0

      108.3

      108.4

      (R). Manufacture of Electrical Equipment

      3.64437

      111.5

      113.2

      115.8

      (S). Manufacture of Machinery and Equipment n.e.c.

      5.07784

      102.2

      103.9

      102.7

      (T). Manufacture of Motor Vehicles, Trailers and Semi-Trailers, and Manufacture of Other Transport Equipment

      10.49446

      101.5

      102.8

      104.1

      (U). Manufacture of Furniture

      0.98353

      97.6

      101.0

      101.6

      (V). Other Manufacturing

      3.77741

      88.9

      88.2

      83.1

      (P)-Provisional, (F)-Final

      Part D-Provisional Estimates of Service Producer Price Indices (Base Year 2022-23) for Q4 of FY 2025-26

      Part D-Provisional Estimates of Service PPIs (Base Year 2022-23) for Q4 of FY 2025-26

      The Office of the Economic Adviser (OEA), Department for Promotion of Industry and Internal Trade (DPIIT), M/o Commerce & Industry, has started the compilation of Service Producer Price Index (SPPI) in a phased manner. In first phase, the indices of seven services are compiled using the data from administrative/institutional sources, and will be released quarterly.

      1. The Provisional Estimates of Service Producer Price Indices for Q4 of FY 2025-26 and Final Estimates for Q3 of FY 2025-26 are as below: -

      S. No.

      Service PPI

      Q3: 2025-26 (F)

      Q4: 2025-26 (P)

      1.

      Securities Transaction Service Price Index

      89.2

      91.7

      2.(a)

      Banking Service Price Index

      102.2

      100.9

      2.(b)

      Banking Service Contribution Index

      132.0

      129.7

      3.

      Management of Pension Funds Service Price Index

      106.3

      103.8

      4.

      Insurance Service Price Index

      102.0

      102.8

      5.

      Telecom Service Price Index

      112.2

      112.2

      6.

      Railway Service Price Index

      102.6

      103.3

      6.(a)

      Railway Freight Service Price Index

      103.2

      103.2

      6.(b)

      Railway Passenger Service Price Index

      101.3

      103.5

      7.

      Air (Passenger) Service Price Index

      107.3

      106.9

      (P)-Provisional, (F)-Final

      Note: Weights have not been assigned to aforementioned services as these services do not cover the entire service sector. However, sub-service level weights under each service, have been computed using the data of FY 2022-23 for arriving at the PPI of respective Services.

      1. Annual Service Producer Price Indices (Base Year 2022-23) for FY 2023-24, FY 2024-25, and FY 2025-26 are given at Annexure-VII.
      2. Quarterly Service PPIs from Q1 of FY 2023-24 to Q4 of FY 2025-26 are available at (https://eaindustry.nic.in/download_data_2223.asp).

      Annexure-VII

      Annual Service PPIs

      S.No.

      Service PPI

      2023-24

      2024-25

      2025-26 (P)

      1

      Securities Transaction Service Price Index

      106.7

      95.9

      91.1

      2.(a)

      Banking Service Price Index

      104.9

      106.3

      102.8

      2.(b)

      Banking Service Contribution Index

      115.8

      126.4

      129.4

      3.

      Management of Pension Funds Service Price Index

      101.6

      105.6

      106.6

      4.

      Insurance Service Price Index

      99.9

      102.6

      102.4

      5.

      Telecom Service Price Index

      102.5

      109.3

      111.9

      6.

      Railway Service Price Index

      101.3

      102

      102.3

      6.(a)

      Railway Freight Service Price Index

      102.0

      103.0

      102.7

      6.(b)

      Railway Passenger Service Price Index

      100.0

      100.0

      101.5

      7.

      Air (Passenger) Service Price Index

      -

      -

      101.1

      - Index is not compiled as the price reference period is FY 2025-26.

      ***

      Topics

      ActsIncome Tax
