Login
Just a moment...
Press 'Enter' to add multiple search terms. Rules for Better Search
Press 'Enter' after typing page number.
Press 'Enter' after typing page number.
No Folders have been created
Are you sure you want to delete "My most important" ?
NOTE:
Press 'Enter' after typing page number.
Press 'Enter' after typing page number.
All News
Press 'Enter' after typing page number.
Press 'Enter' after typing page number.
All News
Note
Bookmark
Share
Don't have an account? Register Here
GOVERNMENT’S SOCIAL SERVICES EXPENDITURE (SSE) RISES IN TOTAL EXPENDITURE (TE), FROM 23.3% IN FY21 TO 26.2% IN FY25 (BE)
URBAN-RURAL GAP IN CONSUMPTION EXPENDITURE DECLINES TO 70% IN 2023-24 FROM 84% IN 2011-12
Government’s focus on empowering citizens through education, healthcare, skill development, and social infrastructure development have seen significant progress, states Economic Survey 2024-25. The document was tabled in Parliament today by Union Minister for Finance and Corporate Affairs, Smt. Nirmala Sitharaman.
Trends in Social Service Expenditure
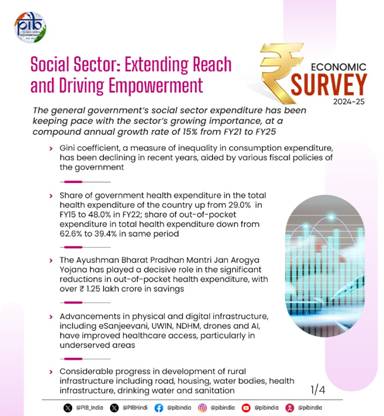
Highlighting an increase from 23.3% in FY21 to 26.2% per cent in FY25 (BE) or a CAGR of 15%, the Economic Survey notes a rising trend in Government’s social services expenditure (SSE), as a percentage of total expenditure (TE). While the SSE outlay of the Centre and State governments was Rs. 14.8 lakh crore in FY21, it has increased steadily to stand at ₹25.7 lakh crore in FY25 (BE).
On Education, the Survey notes that the expenditure in the sector has grown at a CAGR of 12%, from Rs. 5.8 lakh crore in FY21 to Rs. 9.2 lakh crore in FY25 (BE). On the other hand, the Survey noted a growing trend in Health sector expenditure at CAGR of 18 per cent, from Rs. 3.2 lakh crore in FY21 to Rs. 6.1 lakh crore in FY25 (BE). In the total health expenditure of the country between FY15 and FY22, the share of government health expenditure has increased from 29.0 per cent to 48.0 per cent, the Survey noted.
Consumption Expenditure
Evidence shows that government schemes have spurred consumption and income generating activity in low-income households, observes the Economic Survey. Various government welfare schemes such as free or subsidized food grains, subsidized cooking fuel, insurance cover, Direct Benefit Transfers under various schemes are lifting household incomes. These fiscal transfers help to provide additional resources to the financially deprived sections and, thus, favourably impact people's standard of living.
Social sector initiatives have reduced inequality and increased consumption spending, as reflected in the Survey. The Gini coefficient, a measure of inequality in consumption expenditure, has been declining in recent years. For rural areas, it declined to 0.237 in 2023-24 from 0.266 in 2022-23, and, in urban areas it fell to 0.284 in 2023-24 from 0.314 in 2022-23.
The Survey document highlights the results of the Household Consumption Expenditure Survey (HCES) 2023-24, which observes that the urban-rural gap in consumption expenditure is narrowing. The largest growth in average Monthly Per Capita Expenditure (MPCE) between FY 2022-23 and FY 2023-24 occurred among the bottom 5-10% of the population in both rural and urban areas. The urban-rural gap in average MPCE has declined to 71% in 2022-23 from 84% in 2011-12. It has further come down to 70% in 2023-24, which confirms the sustained momentum of consumption growth in rural areas.
The Economic Survey notes that various fiscal policies of the government are reshaping income distribution. Food subsidies constitute the largest fiscal outlay in the government’s diverse set of social schemes. In 2022-23, Union government spent 6.5% of its budget on the PM Pradhan Mantri Garib Kalyan Anna Yojana (PMGKAY) to provide free and subsidized food rations.
The concentration of larger benefits among lower consumption groups suggests that the PDS/PMGKAY policies support the low income and protect other vulnerable households against income fluctuations and impoverishment. On an average in 2022-23, the value of the subsidy accounted for 7% of household consumption among the rural bottom 20%, but only for 2% among the top 20%. A similar progressive pattern is observed in urban areas.
The survey also provides insights into the allocation of these benefits across different segments of the population. In 2022-23, 84% of the population had access to a ration card, including 59% who reported holding a Below Poverty Line (BPL), Antyodaya Anna Yojana (AAY) or Priority Household (PHH) card in their household.
Government welfare schemes boost low income household consumption and narrow consumption inequality through targeted fiscal transfers. Government welfare schemes, delivered through fiscal transfers such as food subsidies, subsidized fuel, insurance and Direct Benefit Transfers, have increased resources for low-income households and disproportionately benefited lower consumption groups, thereby stimulating consumption and income-generating activity. The Economic Survey 2024-25 links rising social services expenditure, growth in education and health outlays, widespread ration-card coverage, and progressive subsidy incidence to declining Gini coefficients and a narrowing urban-rural consumption gap, with the largest MPCE gains recorded among the poorest percentiles.Press 'Enter' after typing page number.