Login
Just a moment...
Press 'Enter' to add multiple search terms. Rules for Better Search
Press 'Enter' after typing page number.
Press 'Enter' after typing page number.
No Folders have been created
Are you sure you want to delete "My most important" ?
NOTE:
Press 'Enter' after typing page number.
Press 'Enter' after typing page number.
All News
Press 'Enter' after typing page number.
Press 'Enter' after typing page number.
All News
Note
Bookmark
Share
Don't have an account? Register Here
The cumulative value of merchandise exports during April-July 2024 was USD 144.12 Billion as compared to USD 138.39 Billion during April-July 2023, registering a positive growth of 4.15%.
Non-petroleum & Non-Gems & Jewellery exports registered an increase of5.69% from USD 25.47 Billion in July 2023 to USD 26.92 Billion in July 2024.
Major drivers of merchandise exports growth in July 2024 include Electronic Goods, Engineering Goods, Drugs & Pharmaceuticals, Meat, dairy & poultry products and RMG of all Textiles.
Electronic goods exports increased by 37.31% from USD 2.04 Billion in July 2023 to USD 2.81 Billion in July 2024.
Engineering Goods exports increased by 3.66% from USD 8.72 Billion in July 2023 to USD 9.04 Billion in July 2024.
Drugs and pharmaceuticals exports increased by 8.36% from USD 2.13 Billion in July 2023 to USD 2.31 Billion in July 2024.
Meat, dairy & poultry products exports increased by 56.18% from USD 0.29 Billion in July 2023 to USD 0.46 Billion in July 2024.
RMG of all Textiles exports increased by 11.84% from USD 1.14 Billion in July 2023 to USD 1.28 Billion in July 2024.
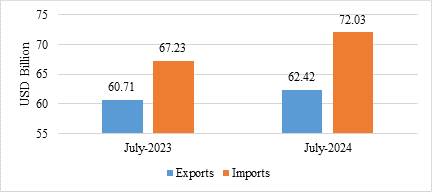
India’s total exports (Merchandise and Services combined) for July 2024* is estimated at USD 62.42 Billion, registering a positive growth of 2.81 percent vis-à-vis July 2023.Total imports (Merchandise and Services combined) for July 2024* is estimated at USD 72.03 Billion, registering a positive growth of 7.14 percent vis-à-vis July 2023.
Table 1: Trade during July 2024*
|
| July 2024 (USD Billion) | July 2023 (USD Billion) |
Merchandise | Exports | 33.98 | 34.49 |
Imports | 57.48 | 53.49 | |
Services* | Exports | 28.43 | 26.22 |
Imports | 14.55 | 13.74 | |
Total Trade (Merchandise +Services) * | Exports | 62.42 | 60.71 |
Imports | 72.03 | 67.23 | |
Trade Balance | -9.61 | -6.52 |
* Note: The latest data for services sector released by RBI is for June2024. The data for July 2024 is an estimation, which will be revised based on RBI’s subsequent release.
Fig 1: Total Trade during July2024*
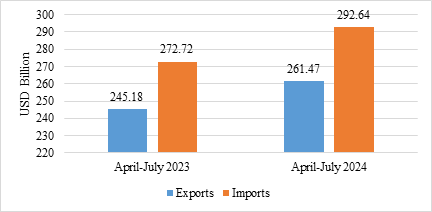
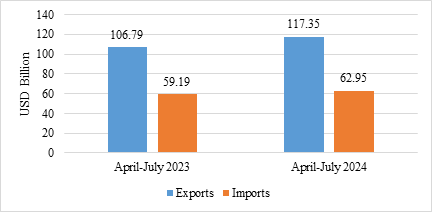
India’s total exports during April-July2024* is estimated at USD 261.47 Billion registering a positive growth of 6.65 percent. Total imports during April-July 2024* is estimated at USD 292.64 Billion registering a growth of 7.30 percent.
Table 2: Trade during April-July 2024*
|
| April-July 2024 (USD Billion) | April-July 2023 (USD Billion) |
Merchandise | Exports | 144.12 | 138.39 |
Imports | 229.70 | 213.53 | |
Services* | Exports | 117.35 | 106.79 |
Imports | 62.95 | 59.19 | |
Total Trade (Merchandise +Services) * | Exports | 261.47 | 245.18 |
Imports | 292.64 | 272.72 | |
Trade Balance | -31.17 | -27.55 |
Fig 2: Total Trade during April-July 2024*
MERCHANDISE TRADE
Fig 3: Merchandise Trade during July 2024
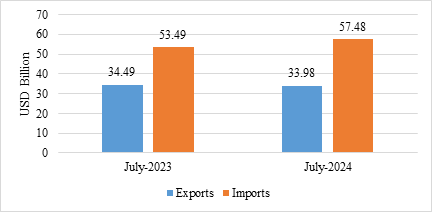
Fig4: Merchandise Trade during April-July 2024
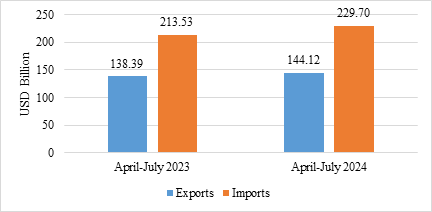
Table 3: Trade excluding Petroleum and Gems & Jewellery during July 2024
| July 2024(USD Billion) | July 2023 (USD Billion) |
Non- petroleum exports | 28.75 | 27.77 |
Non- petroleum imports | 43.61 | 41.67 |
Non-petroleum & Non-Gems & Jewellery exports | 26.92 | 25.47 |
Non-petroleum & Non-Gems & Jewellery imports | 38.98 | 36.16 |
Note: Gems & Jewellery Imports include Gold, Silver & Pearls, precious & Semi-precious stones
Fig 5: Trade excluding Petroleum and Gems & Jewellery during July 2024
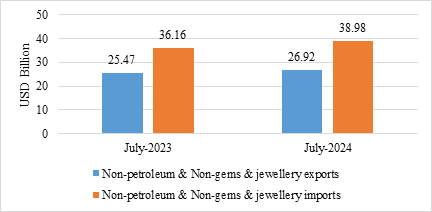
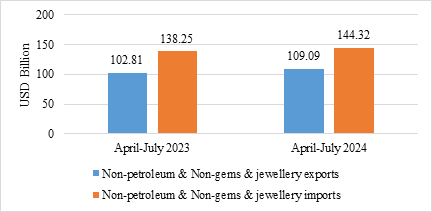
Table 4: Trade excluding Petroleum and Gems & Jewellery during April-July 2024
| April-July 2024(USD Billion) | April-July 2023 (USD Billion) |
Non- petroleum exports | 118.19 | 112.64 |
Non- petroleum imports | 164.33 | 159.87 |
Non-petroleum &Non Gems& Jewellery exports | 109.09 | 102.81 |
Non-petroleum & Non Gems & Jewellery imports | 144.32 | 138.25 |
Note: Gems & Jewellery Imports include Gold, Silver & Pearls, precious & Semi-precious stones
Fig 6: Trade excluding Petroleum and Gems & Jewellery during April-July 2024
SERVICES TRADE
Fig 7: Services Trade during July2024*
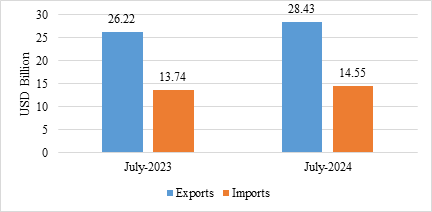
Fig 8: Services Trade during April-July 2024*
Press 'Enter' after typing page number.