Login
Just a moment...
Press 'Enter' to add multiple search terms. Rules for Better Search
Press 'Enter' after typing page number.
Press 'Enter' after typing page number.
No Folders have been created
Are you sure you want to delete "My most important" ?
NOTE:
Press 'Enter' after typing page number.
Press 'Enter' after typing page number.
All News
Press 'Enter' after typing page number.
Press 'Enter' after typing page number.
All News
Note
Bookmark
Share
Don't have an account? Register Here
Yearly gross revenue ₹20.14 lakh crore; 11.7% growth (13.4% on net basis)
Gross Good and Services Tax (GST) revenue for March 2024 witnessed the second highest collection ever at ₹1.78 lakh crore, with a 11.5% year-on-year growth. This surge was driven by a significant rise in GST collection from domestic transactions at 17.6%. GST revenue net of refunds for March 2024 is ₹1.65 lakh crore which is growth of 18.4% over same period last year.
Strong Consistent Performance in FY 2023-24: FY 2023-24 marks a milestone with total gross GST collection of Rs. 20.14 lakh crore exceeding ₹20 lakh crore, a 11.7% increase compared to the previous year. The average monthly collection for this fiscal year stands at ₹1.68 lakh crore, surpassing the previous year’s average of ₹1.5 lakh crore. GST revenue net of refunds as of March 2024 for the current fiscal year is ₹18.01 lakh crore which is a growth of 13.4% over same period last year.
Positive Performance Across Components:
Breakdown of March 2024 Collections:
Similar positive trends are observed in the entire FY 2023-24 collections:
Inter-Governmental Settlement: In the month of March, 2024, the Central Government settled ₹43,264 crore to CGST and ₹37,704 crore to SGST from the IGST collected. This translates to a total revenue of ₹77,796 crore for CGST and ₹81,450 crore for SGST for March, 2024 after regular settlement. For the FY 2023-24, the central government settled ₹4,87,039 crore to CGST and ₹4,12,028 crore to SGST from the IGST collected.
The chart below shows trends in monthly gross GST revenues during the current year. Table-1 shows the state-wise figures of GST collected in each State during the month of March, 2024 as compared to March, 2023. Table-2 shows the state-wise figures of post settlement GST revenue of each State till the month of March, 2024.
Chart: Trends in GST Collection
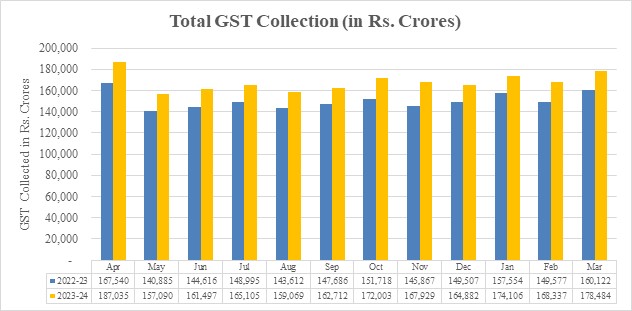
Table 1: State-wise growth of GST Revenues during March, 2024[1]
State/UT | Mar-23 | Mar-24 | Growth (%) |
Jammu and Kashmir | 477 | 601 | 26% |
Himachal Pradesh | 739 | 852 | 15% |
Punjab | 1,735 | 2,090 | 20% |
Chandigarh | 202 | 238 | 18% |
Uttarakhand | 1,523 | 1,730 | 14% |
Haryana | 7,780 | 9,545 | 23% |
Delhi | 4,840 | 5,820 | 20% |
Rajasthan | 4,154 | 4,798 | 15% |
Uttar Pradesh | 7,613 | 9,087 | 19% |
Bihar | 1,744 | 1,991 | 14% |
Sikkim | 262 | 303 | 16% |
Arunachal Pradesh | 144 | 168 | 16% |
Nagaland | 58 | 83 | 43% |
Manipur | 65 | 69 | 6% |
Mizoram | 70 | 50 | -29% |
Tripura | 90 | 121 | 34% |
Meghalaya | 202 | 213 | 6% |
Assam | 1,280 | 1,543 | 21% |
West Bengal | 5,092 | 5,473 | 7% |
Jharkhand | 3,083 | 3,243 | 5% |
Odisha | 4,749 | 5,109 | 8% |
Chhattisgarh | 3,017 | 3,143 | 4% |
Madhya Pradesh | 3,346 | 3,974 | 19% |
Gujarat | 9,919 | 11,392 | 15% |
Dadra and Nagar Haveli and Daman & Diu | 309 | 452 | 46% |
Maharashtra | 22,695 | 27,688 | 22% |
Karnataka | 10,360 | 13,014 | 26% |
Goa | 515 | 565 | 10% |
Lakshadweep | 3 | 2 | -18% |
Kerala | 2,354 | 2,598 | 10% |
Tamil Nadu | 9,245 | 11,017 | 19% |
Puducherry | 204 | 221 | 9% |
Andaman and Nicobar Islands | 37 | 32 | -14% |
Telangana | 4,804 | 5,399 | 12% |
Andhra Pradesh | 3,532 | 4,082 | 16% |
Ladakh | 23 | 41 | 82% |
Other Territory | 249 | 196 | -21% |
Center Jurisdiction | 142 | 220 | 55% |
Grand Total | 1,16,659 | 1,37,166 | 18% |
Table-2: SGST & SGST portion of IGST settled to States/UTs April-March (Rs. in crore)
| Pre-Settlement SGST | Post-Settlement SGST[2] | ||||
State/UT | 2022-23 | 2023-24 | Growth | 2022-23 | 2023-24 | Growth |
Jammu and Kashmir | 2,350 | 2,945 | 25% | 7,272 | 8,093 | 11% |
Himachal Pradesh | 2,346 | 2,597 | 11% | 5,543 | 5,584 | 1% |
Punjab | 7,660 | 8,406 | 10% | 19,422 | 22,106 | 14% |
Chandigarh | 629 | 689 | 10% | 2,124 | 2,314 | 9% |
Uttarakhand | 4,787 | 5,415 | 13% | 7,554 | 8,403 | 11% |
Haryana | 18,143 | 20,334 | 12% | 30,952 | 34,901 | 13% |
Delhi | 13,619 | 15,647 | 15% | 28,284 | 32,165 | 14% |
Rajasthan | 15,636 | 17,531 | 12% | 35,014 | 39,140 | 12% |
Uttar Pradesh | 27,366 | 32,534 | 19% | 66,052 | 76,649 | 16% |
Bihar | 7,543 | 8,535 | 13% | 23,384 | 27,622 | 18% |
Sikkim | 301 | 420 | 39% | 839 | 951 | 13% |
Arunachal Pradesh | 494 | 628 | 27% | 1,623 | 1,902 | 17% |
Nagaland | 228 | 307 | 35% | 964 | 1,057 | 10% |
Manipur | 321 | 346 | 8% | 1,439 | 1,095 | -24% |
Mizoram | 230 | 273 | 19% | 892 | 963 | 8% |
Tripura | 435 | 512 | 18% | 1,463 | 1,583 | 8% |
Meghalaya | 489 | 607 | 24% | 1,490 | 1,713 | 15% |
Assam | 5,180 | 6,010 | 16% | 12,639 | 14,691 | 16% |
West Bengal | 21,514 | 23,436 | 9% | 39,052 | 41,976 | 7% |
Jharkhand | 7,813 | 8,840 | 13% | 11,490 | 12,456 | 8% |
Odisha | 14,211 | 16,455 | 16% | 19,613 | 24,942 | 27% |
Chhattisgarh | 7,489 | 8,175 | 9% | 11,417 | 13,895 | 22% |
Madhya Pradesh | 10,937 | 13,072 | 20% | 27,825 | 33,800 | 21% |
Gujarat | 37,802 | 42,371 | 12% | 58,009 | 64,002 | 10% |
Dadra and Nagar Haveli and Daman and Diu | 637 | 661 | 4% | 1,183 | 1,083 | -8% |
Maharashtra | 85,532 | 1,00,843 | 18% | 1,29,129 | 1,49,115 | 15% |
Karnataka | 35,429 | 40,969 | 16% | 65,579 | 75,187 | 15% |
Goa | 2,018 | 2,352 | 17% | 3,593 | 4,120 | 15% |
Lakshadweep | 10 | 19 | 93% | 47 | 82 | 75% |
Kerala | 12,311 | 13,967 | 13% | 29,188 | 30,873 | 6% |
Tamil Nadu | 36,353 | 41,082 | 13% | 58,194 | 65,834 | 13% |
Puducherry | 463 | 509 | 10% | 1,161 | 1,366 | 18% |
Andaman and Nicobar Islands | 183 | 206 | 12% | 484 | 528 | 9% |
Telangana | 16,877 | 20,012 | 19% | 38,008 | 40,650 | 7% |
Andhra Pradesh | 12,542 | 14,008 | 12% | 28,589 | 31,606 | 11% |
Ladakh | 171 | 250 | 46% | 517 | 653 | 26% |
Other Territory | 201 | 231 | 15% | 721 | 1,123 | 56% |
Grand Total | 4,10,251 | 4,71,195 | 15% | 7,70,747 | 8,74,223 | 13% |
GST revenue growth reflects stronger domestic collections and higher net receipts following inter-governmental settlements in the current fiscal year Gross GST revenue for March 2024 was the second-highest monthly collection, led by higher domestic transactions, and net-of-refunds receipts for March and FY 2023-24 showed significant year-on-year growth. The release presents component-wise figures for CGST, SGST, IGST (including imports) and cess, and describes IGST-based settlements from the Centre to states that determine post-settlement state receipts. State-wise comparisons and pre- and post-settlement SGST tables illustrate differing growth rates and the settlement mechanism's effect on distributable revenues.
Press 'Enter' after typing page number.