Overall trade deficit improves by 45.22% during July 2023 to USD 8.35 Billion from USD 15.24 Billion in July 2022. Merchandise Trade Deficit also improves by 18.74% at USD 20.67 Billion in July 2023 as compared to USD 25.44 Billion in July 2022
Iron Ore exports registered significant increase of 962.82% in July 2023 as compared to July 2022, and an increase of 64.52% during April-July 2023 over April-July 2022
Electronic Goods exports registered growth of 13.09% and 37.6% in July 2023 and April-July 2023 respectively over corresponding period last year
Ceramic Products & Glassware exports registered growth of 20.82% and 12.39% in July 2023 and April-July 2023 respectively over corresponding period last year
Agricultural exports registered robust growth: Fruits and Vegetables exports increase by 18.94%, Oil Seeds by 32.83%, Oil Meals by 34.24%, Rice by 5.38% in July 2023 over July 2022
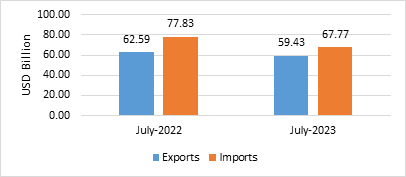
India’s overall exports (Merchandise and Services combined) in July 2023* is estimated to be USD 59.43 Billion, exhibiting a negative growth of (-) 5.06 per cent over July 2022. Overall imports in July 2023* is estimated to be USD 67.77 Billion, exhibiting a negative growth of (-) 12.92 per cent over July 2022.
Table 1: Trade during July 2023*
| | July 2023 (USD Billion) | July 2022 (USD Billion) |
Merchandise | Exports | 32.25 | 38.34 |
Imports | 52.92 | 63.77 |
Services* | Exports | 27.17 | 24.26 |
Imports | 14.85 | 14.06 |
Overall Trade (Merchandise +Services) * | Exports | 59.43 | 62.59 |
Imports | 67.77 | 77.83 |
Trade Balance | -8.35 | -15.24 |
* Note: The latest data for services sector released by RBI is for June 2023. The data for July 2023 is an estimation, which will be revised based on RBI’s subsequent release. (ii) Data for April-July 2022 has been revised on pro-rata basis using quarterly balance of payments data.
Fig 1: Overall Trade during July 2023*
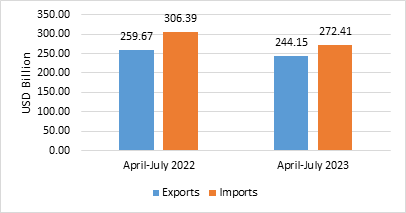
- India’s overall exports (Merchandise and Services combined) in April-July 2023 is estimated to exhibit a negative growth of (-) 5.98 per cent over April-July 2022. Overall imports in April-July 2023 is estimated to exhibit a negative growth of (-) 11.09 per cent over April-July 2022.
Table 2: Trade during April-July 2023*
| | April-July 2023 (USD Billion) | April-July 2022 (USD Billion) |
Merchandise | Exports | 136.22 | 159.32 |
Imports | 213.20 | 247.31 |
Services* | Exports | 107.93 | 100.35 |
Imports | 59.21 | 59.09 |
Overall Trade (Merchandise+Services) * | Exports | 244.15 | 259.67 |
Imports | 272.41 | 306.39 |
Trade Balance | -28.26 | -46.72 |
Fig 2: Overall Trade during April-July 2023*
MERCHANDISE TRADE
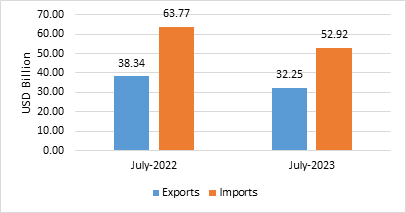
- Merchandise exports in July 2023 were USD 32.25 Billion, as compared to USD 38.34 Billion in July 2022.
- Merchandise imports in July 2023 were USD 52.92 Billion, as compared to USD 63.77 Billion in July 2022.
Fig 3: Merchandise Trade during July 2023
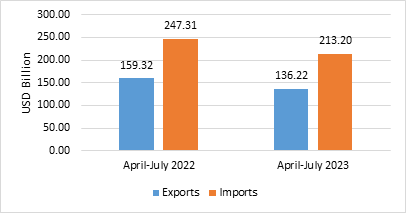
- Merchandise exports for the period April-July 2023 were USD 136.22 Billion as against USD 159.32 Billion during April-July 2022.
- Merchandise imports for the period April-July 2023 were USD 213.20 Billion as against USD 247.31 Billion during April-July 2022.
- The merchandise trade deficit for April-July 2023 was estimated at USD 76.98 Billion as against USD 87.99 Billion during April-July 2022.
Fig 4: Merchandise Trade during April-July 2023
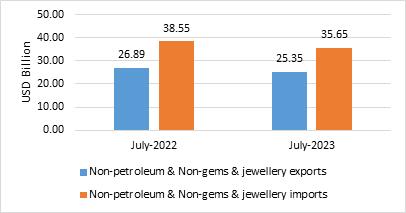
- Non-petroleum and non-gems & jewellery exports in July 2023 were USD 25.35 Billion, compared to USD 26.89 Billion in July 2022.
- Non-petroleum, non-gems & jewellery (gold, silver & precious metals) imports in July 2023 were USD 35.65 Billion, compared to USD 38.55 Billion in July 2022.
Table 3: Trade excluding Petroleum and Gems & Jewellery during July 2023
| July 2023 (USD Billion) | July 2022 (USD Billion) |
Non- petroleum exports | 27.66 | 30.17 |
Non- petroleum imports | 41.17 | 45.22 |
Non-petroleum & Non Gems & Jewellery exports | 25.35 | 26.89 |
Non-petroleum & Non Gems & Jewellery imports | 35.65 | 38.55 |
Note: Gems &Jewellery Imports include Gold, Silver & Pearls, precious & Semi-precious stones
Fig 5: Trade excluding Petroleum and Gems & Jewellery during July 2023
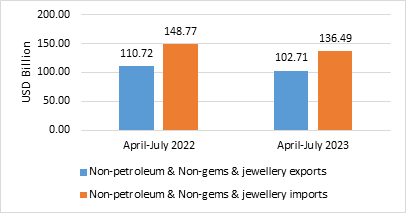
- Non-petroleum and non-gems & jewellery exports during April-July 2023 was USD 102.71 Billion, as compared to USD 110.72 Billion in April-July 2022.
- Non-petroleum, non-gems & jewellery (gold, silver & precious metals) imports were USD 136.49 Billion in April-July 2023 as compared to USD 148.77 Billion in April-July 2022.
Table 4: Trade excluding Petroleum and Gems & Jewellery during April-July 2023
| April-July 2023 (USD Billion) | April-July 2022 (USD Billion) |
Non- petroleum exports | 112.54 | 124.23 |
Non- petroleum imports | 158.11 | 175.57 |
Non-petroleum & Non Gems & Jewellery exports | 102.71 | 110.72 |
Non-petroleum & Non Gems & Jewellery imports | 136.49 | 148.77 |
Note: Gems &Jewellery Imports include Gold, Silver & Pearls, precious & Semi-precious stones
Fig 6: Trade excluding Petroleum and Gems & Jewellery during April-July 2023
SERVICES TRADE
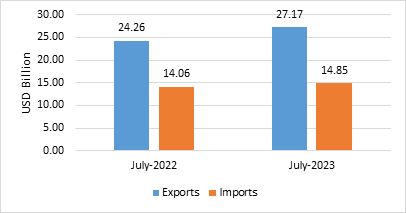
- The estimated value of services export for July 2023* is USD 27.17 Billion, as compared to USD 24.26 Billion in July 2022.
- The estimated value of services imports for July 2023* is USD 14.85 Billion as compared to USD 14.06 Billion in July 2022.
Fig 7: Services Trade during July 2023*
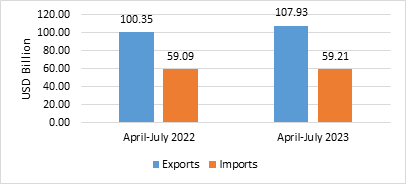
- The estimated value of services export for April-July 2023* is USD 107.93 Billion as compared to USD 100.35 Billion in April-July 2022.
- The estimated value of services imports for April-July 2023* is USD 59.21 Billion as compared to USD 59.09 Billion in April-July 2022.
- The services trade surplus for April-July 2023* is estimated at USD 48.72 Billion as against USD 41.27 Billion in April-July 2022.
Fig 8: Services Trade during April-July 2023
- India’s trade performance, after witnessing very high growth in 2022-23 has continue to show declining trends in July as compared to high base of last year in the backdrop of global slowdown.
- For the month of July 2023, under merchandise exports, 11 of the 30 key sectors exhibited positive growth in July 2023 as compared to same period last year (July 2022). These include Iron Ore (962.82%), Oil Meals (34.24%), Oil Seeds (32.83%), Ceramic Products & Glassware (20.82%), Fruits & Vegetables (18.94%), Electronic Goods (13.09%), Coffee (11.9%), Cotton Yarn/Fabs./Made-Ups, Handloom Products Etc. (6.62%), Rice (5.38%), Cereal Preparations & Miscellaneous Processed Items (2.56%) and Drugs & Pharmaceuticals (0.09%).
- Exports of Electronic goods increased by 13.09 percent during July 2023 at USD 2.05 Billion as compared to USD 1.81 Billion in July 2022. During April-July 2023 electronic goods exports were recorded at USD 9.01 Billion as compared to USD 6.55 Billion during April-July 2022, registering a growth of 37.60 percent. Enabling policies facilitating greater investment in electronics, mobile manufacturing, etc. has resulted in visible growth in these sectors.
- Under merchandise imports, 16 out of 30 key sectors exhibited negative growth in July 2023. These include Silver (-97.17%), Project Goods (-69.48%), Cotton Raw & Waste (-54.24%), Coal, Coke & Briquettes, Etc. (-47.2%), Fertilisers, Crude & Manufactured (-41.48%), Pearls, Precious & Semi-Precious Stones (-38.37%), Petroleum, Crude & Products (-36.65%), Newsprint (-32.07%), Organic & Inorganic Chemicals (-26.13%), Textile Yarn Fabric, Made-Up Articles (-24.67%), Leather & Leather Products (-19.35%), Vegetable Oil (-19.01%), Fruits & Vegetables (-17.58%), Wood & Wood Products (-13.13%), Artificial Resins, Plastic Materials, Etc. (-11.93%) and Metaliferrous Ores & Other Minerals (-1.51%).
- For April-July 2023, under merchandise exports, 11 of the 30 key sectors exhibited positive growth during April-July 2023 as compared to April-July 2022. These include Iron Ore (64.52%), Electronic Goods (37.6%), Oil Meals (33.36%), Oil Seeds (26.95%), Fruits & Vegetables (15.15%), Ceramic Products & Glassware (12.39%), Spices (10.14%), Coffee (5.98%), Rice (4.08%), Drugs & Pharmaceuticals (3.99%) and Tobacco (3.21%).
- Under merchandise imports, 19 of the 30 key sectors exhibited negative growth in April-July 2023 as compared to April-July 2022. These include Silver (-91.12%), Sulphur & Unroasted Iron Pyrites (-50.73%), Project Goods (-41.92%), Cotton Raw & Waste (-38.69%), Coal, Coke & Briquettes, Etc. (-35.88%), Vegetable Oil (-29.05%), Pearls, Precious & Semi-Precious Stones (-28.76%), Organic & Inorganic Chemicals (-27.34%), Petroleum, Crude & Products (-23.21%), Textile Yarn Fabric, Made-Up Articles (-22.64%), Fertilisers, Crude & Manufactured (-21.76%), Artificial Resins, Plastic Materials, Etc. (-13.59%), Wood & Wood Products (-13.35%), Fruits & Vegetables (-12.33%), Metaliferrous Ores & Other Minerals (-11.17%), Leather & Leather Products (-8.06%), Medicinal & Pharmaceutical Products (-4.89%), Transport Equipment (-4.23%) and Newsprint (-3.6%).
- Silver imports slumped by 97.17 percent from USD 1.08 Billion in July 2022 to USD 0.03 Billion in July 2023.
- Services exports is projected to grow positively at 7.56 percent during April-July 2023 over April-July 2022.
- India’s trade deficit has shown considerable decline in April-July 2023. Overall trade deficit for April-July 2023* is estimated at USD 28.26 Billion as compared to the deficit of USD 46.72 Billion during April-July 2022, registering a decline of (-) 39.52 percent. The merchandise trade deficit during April-July 2023 was USD 76.98 Billion compared to USD 87.99 Billion during April-July 2022, registering a decline of (-) 12.51 percent.
* Link for quick Estimates
***
Trade deficit improvement follows stronger services surplus despite contraction in merchandise exports across key sectors. India's July 2023 trade shows overall export contraction offset by larger import declines, producing a narrower trade deficit; merchandise exports fell while services exports rose, with provisional services estimates subject to revision and sectoral divergences-iron ore, electronics and certain agricultural products grew, whereas petroleum, gems & jewellery and several intermediate goods contracted.