Login
Just a moment...
Press 'Enter' to add multiple search terms. Rules for Better Search
Press 'Enter' after typing page number.
Press 'Enter' after typing page number.
No Folders have been created
Are you sure you want to delete "My most important" ?
NOTE:
Press 'Enter' after typing page number.
Press 'Enter' after typing page number.
All News
Press 'Enter' after typing page number.
Press 'Enter' after typing page number.
All News
Note
Bookmark
Share
Don't have an account? Register Here
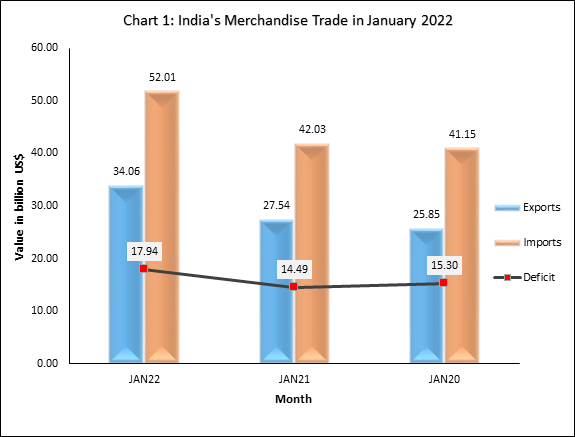
India’s merchandise export in January 2022 increases by 23.69% to USD 34.06 billion over USD 27.54 billion in January 2021; records increase of 31.75% over USD 25.85 billion in January 2020
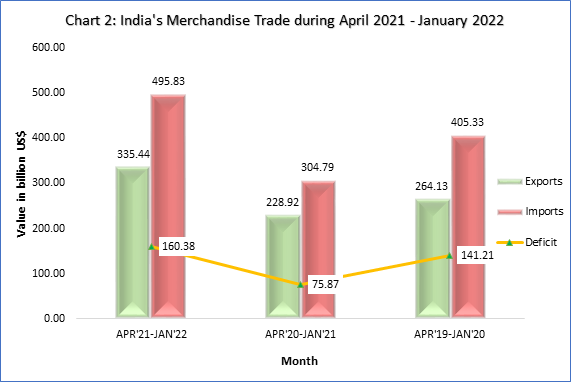
India’s merchandise export in 2021-22 (April-January) rises by 46.53% to USD 335.44 billion over USD 228.9 billion in 2020-21 (April-January); marks an increase of 27.0% over USD 264.13 billion in 2019-20 (April-January)
INDIA’S MERCHANDISE TRADE: Preliminary Data January 2022
India’s merchandise import in January 2022 was USD 52.01 billion, an increase of 23.74% over USD 42.03 billion in January 2021 and an increase of 26.38% over USD 41.15 billion in January 2020.
India’s merchandise import in 2021-22 (April-January) was USD 495.83 billion, an increase of 62.68% over USD 304.79 billion in 2020-21 (April-January) and an increase of 22.3% over USD 405.33 billion in 2019-20 (April-January).
The trade deficit in January 2022 was USD 17.94 billion, while it was 160.38 billion USD during 2021-22 (April-January).
Statement 1: India’s Merchandise Trade in January 2022 | |||||
| Value in Billion USD | % Growth | |||
Jan-22 | Jan-21 | Jan-20 | Jan-22 over Jan-21 | Jan-22 over Jan-20 | |
Exports | 34.06 | 27.54 | 25.85 | 23.69 | 31.75 |
Imports | 52.01 | 42.03 | 41.15 | 23.74 | 26.38 |
Deficit | 17.94 | 14.49 | 15.30 | 23.82 | 17.30 |
Statement 2: India’s Merchandise Trade in 2021-22 (April-January) | |||||
| Value in Billion USD | % Growth | |||
| 2021-22 (Apr-Jan) | 2020-21 (Apr-Jan) | 2019-20 (Apr-Jan) | 2021-22 (Apr-Jan) over 2020-21 (Apr-Jan) | 2021-22 (Apr-Jan) over 2019-20 (Apr-Jan) |
Exports | 335.44 | 228.90 | 264.13 | 46.53 | 27.0 |
Imports | 495.83 | 304.79 | 405.33 | 62.68 | 22.30 |
Deficit | 160.38 | 75.87 | 141.2 | 112.97 | 13.51 |
Value of non-petroleum exports in January 2022 was 30.33 USD billion, registering a positive growth of 19.4% over non-petroleum exports of USD 25.4 billion in January 2021 and a positive growth of 33.81% over non-petroleum exports of USD 22.67 billion in January 2020.
Value of non-petroleum imports was USD 40.57 billion in January 2022 with a positive growth of 24.44% over non-petroleum imports of USD 32.61 billion in January 2021 and a positive growth of 44.19% over non-petroleum imports of USD 28.14 billion in January 2020.
Statement 3: Merchandise Non-POL Trade in January 2022 | |||||
| Value in Billion USD | % Growth | |||
| Jan-22 | Jan-21 | Jan-20 | 2021-22 (Apr-Jan) | 2020-21 (Apr-Jan) |
Exports | 30.33 | 25.40 | 22.67 | 19.40 | 33.81 |
Imports | 40.57 | 32.61 | 28.14 | 24.44 | 44.19 |
The cumulative value of non-petroleum exports in 2021-22 (Apr-Jan) was USD 287.84 billion, an increase of 37.59% over USD 209.19 billion in 2020-21 (Apr-Jan) and an increase of 25.8% over USD 228.8 billion in 2019-20 (Apr-Jan).
The cumulative value of non-petroleum imports in 2021-22 (Apr-Jan) was USD 366.14 billion, showing an increase of 51.67% compared to non-oil imports of USD 241.41 billion in 2020-21 (Apr-Jan) and an increase of 23.86% compared to non-oil imports of USD 295.61 billion in 2019-20 (Apr-Jan).
Statement 4: Merchandise Non-POL Trade 2021-22 (Apr-Jan) | |||||
| Value in Billion USD | % Growth | |||
| 2021-22(Apr-Jan) | 2021-22 (Apr-Jan) | 2019-20(Apr-Jan) | 2021-22 (Apr-Jan) over 2020-21 (Apr-Jan) | 2021-22 (Apr-Jan) over 2019-20 (Apr-Jan) |
Exports | 287.84 | 209.19 | 228.80 | 37.59 | 25.8 |
Imports | 366.14 | 241.41 | 295.61 | 51.67 | 23.86 |
Value of non-petroleum and non-gems and jewellery exports in January 2022 was USD 27.09 billion, registering a positive growth of 20.1% over non-petroleum and non-gems and jewellery exports of USD 22.56 billion in January 2021 and a positive growth of 36.92% over non-petroleum and non-gems and jewellery exports of USD 19.79 billion in January 2020.
Value of non-oil, non-GJ (gold, silver & Precious metals) imports was USD 35.22 billion in January 2022 with a positive growth of 33.6%over non-oil and non-GJ imports of USD 26.36 billion in January 2021and a positive growth of 41.63% over non-oil and non-GJ imports of USD 24.87 billion in January 2020.
Statement 5: Merchandise Non-POL Non-GJ Trade in January 2022 | |||||
| Value in Billion USD | % Growth | |||
| Jan-22 | Jan-21 | Jan-20 | Jan-22 over Jan-21 | Jan-22 over Jan-20 |
Exports | 27.09 | 22.56 | 19.79 | 20.10 | 36.92 |
Imports | 35.22 | 26.36 | 24.87 | 33.60 | 41.63 |
The cumulative value of non-petroleum and non-gems and jewellery exports in 2021-22 (April-January) was USD 255.69 billion, an increase of 34.95% over cumulative value of non-petroleum and non-gems and jewellery exports of USD 189.47 billion in 2020-21(April-January) and an increase of 29.18% over cumulative value of non-petroleum and non-gems and jewellery exports of USD 197.94 billion in 2019-20 (April-January).
Non-oil, non-GJ (Gold, Silver & Precious Metals) imports was USD 298.65 billion in 2021-22 (April-January), recording a positive growth of 45.06%, as compared to non-oil and non-GJ imports of USD 205.88 billion in 2020-21(April-January) and a positive growth of 19.54% over USD 249.83 billion in 2019-20 (April-January).
Statement 6: Merchandise Non-POL Non-GJ Trade Apr 2021-Jan 2022 | |||||
| Value in Billion USD | % Growth | |||
| 2021-22 (Apr-Jan) | 2021-22 (Apr-Jan) | 2019-20 (Apr-Jan) | 2021-22 (Apr-Jan) over 2020-21 (Apr-Jan) | 2021-22 (Apr-Jan) over 2019-20 (Apr-Jan) |
Exports | 255.69 | 189.47 | 197.94 | 34.95 | 29.18 |
Imports | 298.65 | 205.88 | 249.83 | 45.06 | 19.54 |
Top 10 major commodity groups covering 78% of total exports in January 2022,are –
Statement 7: Exports of Top 10 Major Commodity Groups | ||||
Value of Export (Million US$) | Share (%) | Growth (%) | ||
Major Commodity Group | Jan-22 | Jan-21 | Jan-22 | Jan-22 over Jan-21 |
Engineering goods | 9201.76 | 7413.15 | 27.01 | 24.13 |
Petroleum products | 3732.26 | 2136.00 | 10.96 | 74.73 |
Gems and Jewellery | 3236.98 | 2843.62 | 9.50 | 13.83 |
Organic and Inorganic chemicals | 2447.89 | 1942.16 | 7.19 | 26.04 |
Drugs and Pharmaceuticals | 2054.24 | 2075.22 | 6.03 | -1.01 |
Cotton Yarn/Fabs./Madeups, Handloom products etc. | 1389.46 | 974.54 | 4.08 | 42.58 |
RMG of all Textiles | 1549.00 | 1295.91 | 4.55 | 19.53 |
Electronic goods | 1364.63 | 1180.09 | 4.01 | 15.64 |
Plastic and Linoleum | 844.47 | 638.37 | 2.48 | 32.29 |
Rice | 813.75 | 769.89 | 2.39 | 5.70 |
Total of 10 Major Commodity Groups | 26634.46 | 21268.95 | 78.19 | 25.23 |
Rest | 7428.41 | 6269.33 | 21.81 | 18.49 |
Total Exports | 34062.87 | 27538.28 | 100.00 | 23.69 |
Top 10 major commodity groups covering 75% of total imports in January 2022, are –
Statement 8: Imports of Top 10 Major Commodity Groups | ||||
Import (Million US$) | Share (%) | Growth (%) | ||
Major Commodity Group | Jan-22 | Jan-21 | Jan-22 | Jan-22 over Jan-21 |
Petroleum, Crude & products | 11431.59 | 9424.30 | 21.98 | 21.30 |
Electronic goods | 8216.74 | 5256.61 | 15.80 | 56.31 |
Gold | 2404.19 | 4035.23 | 4.62 | -40.42 |
Machinery, electrical & non-electrical | 4038.80 | 3367.71 | 7.77 | 19.93 |
Organic & Inorganic Chemicals | 2673.76 | 1983.66 | 5.14 | 34.79 |
Pearls, precious & Semi-precious stones | 2332.04 | 2196.40 | 4.48 | 6.18 |
Coal, Coke & Briquettes, etc. | 2606.53 | 1865.66 | 5.01 | 39.71 |
Artificial resins, plastic materials, etc. | 1762.08 | 1530.64 | 3.39 | 15.12 |
Vegetable Oil | 1858.58 | 1135.45 | 3.57 | 63.69 |
Non-ferrous metals | 1831.41 | 1349.99 | 3.52 | 35.66 |
Total of 10 Major Commodity Groups | 39155.69 | 32145.65 | 75.29 | 21.81 |
Rest | 12850.22 | 9884.42 | 24.71 | 30.00 |
Total Imports | 52005.91 | 42030.07 | 100.00 | 23.74 |
Merchandise export growth accelerates, while imports continue to outpace exports, widening the trade deficit and shifting sectoral composition. Merchandise exports and imports both rose in January 2022 compared with January 2021 and January 2020; exports increased substantially led by engineering goods, petroleum products, gems and jewellery, chemicals, textiles and electronics, while imports were driven by petroleum and products, electronic goods, machinery, chemicals and non-ferrous metals. Non-petroleum and non-petroleum non-gems-and-jewellery exports and imports recorded positive growth in January 2022 and cumulatively for April-January 2021-22, but import growth contributed to a larger monthly and cumulative trade deficit.
Press 'Enter' after typing page number.