

Loading...

Top
Help
×

By creating an account you can:

Logo TaxTMI
Call Us / Help / Feedback

Contact Us At :

E-mail: [email protected]

Call / WhatsApp at: +91 99117 96707

For more information, Check Contact Us

FAQs :

To know Frequently Asked Questions, Check FAQs

Most Asked Video Tutorials :

For more tutorials, Check Video Tutorials

Submit Feedback/Suggestion :

Email :
Please provide your email address so we can follow up on your feedback.
Category :
Description :
Min 15 characters 0/2000
Make Most of Text Search
  1. Checkout this video tutorial: How to search effectively on TaxTMI.
  2. Put words in double quotes for exact word search, eg: "income tax"
  3. Avoid noise words such as : 'and, of, the, a'
  4. Sort by Relevance to get the most relevant document.
  5. Press Enter to add multiple terms/multiple phrases, and then click on Search to Search.
  6. Text Search
  7. The system will try to fetch results that contains ALL your words.
  8. Once you add keywords, you'll see a new 'Search In' filter that makes your results even more precise.
  9. Text Search
Add to...
You have not created any category. Kindly create one to bookmark this item!
Create New Category
Hide
Title :
Description :
❮❮ Hide
Default View
Expand ❯❯
Close ✕
🔎 News - Adv. Search
TEXT SEARCH:

Press 'Enter' to add multiple search terms. Rules for Better Search

Search In:
Main Text + AI Text
  • Main Text
  • Main Text + AI Text
  • AI Text
Category: ?
Categorized by AI
---- All Categories ----
  • ---- All Categories ----
  • Income Tax
  • GST
  • Customs, DGFT & SEZ
  • FEMA & RBI
  • Corp. Laws, SEBI & IBC
  • PMLA, Black Money & ED
  • Budget
  • News and Press Release
  • PTI News
Month:
---- All Months ----
  • ---- All Months ----
  • January
  • February
  • March
  • April
  • May
  • June
  • July
  • August
  • September
  • October
  • November
  • December
Year:
---- All Years ----
  • ---- All Years ----
  • 2026
  • 2025
  • 2024
  • 2023
  • 2022
  • 2021
  • 2020
  • 2019
  • 2018
  • 2017
  • 2016
  • 2015
  • 2014
  • 2013
  • 2012
  • 2011
Sort By: ?
In Sort By 'Default', exact matches for text search are shown at the top, followed by the remaining results in their regular order.
Relevance Default Date
    Union Minister of Commerce & Industry Shri Piyush Goyal Chairs CEO Roundtable on Ease of Doing Business for Scaling India’s Data Centre Ecosystem
    India–Afghanistan Joint Working Group on Trade Holds Virtual Meeting; Reviews Measures to Strengthen Bilateral Trade and Economic Cooperation
    PM Surya Ghar Yojana 2026: How to Get Rs 78,000 Solar Subsidy & Cut Your Electricity Bill
    Japan's JCR upgrades India's sovereign rating to 'A-', cites solid growth, improved financial system
    In personal insolvency case before NCLAT, Subhash Chandra opposes formation of 5-member NCLT bench
    GoCredit Launches Free Loan App Checker to Verify If a Lending App Is Real, Fake or RBI Registered
    Rupee falls 2 paise to 94.97 against US dollar in early trade
    Senior bureaucrats attend IICA’s ‘weekend wisdom’ program initiave
    NLMC to Facilitate E-Auction of 459 RINL Land Parcels in Visakhapatnam
    CCI approves acquisition of Aseem Infrastructure Finance Limited by TPG Nicobar SG Pte. Ltd. and related transactions
    CCI approves acquisition of up to 100% equity shareholding of Apollo Fertility Centre (AFCPL) and Apollo Specialty Hospitals (ASHPL) by Kids Clinic In...
    ED arrests businessman in DMF-linked money laundering case
    Rupee gains 27 paise to close at 94.95 against US dollar
    India's CAD widens to USD 4.2 bn in Q1 amid West Asia conflict: RBI data
    Andhra commercial tax collections rise by 11 per cent in August to Rs 4,983 cr
    Govt hikes windfall gains tax on petrol, diesel exports; cuts levy on ATF
    DGFT Enables Automated Issuance of Free Sale and Commerce Certificates to Promote Ease of Doing Business
    Bank unions to go on nationwide strike on Sep 11 over 5-day banking, other issues
    Stock markets close marginally lower amid higher oil prices, fresh US-Iran tensions
    Gross and Net GST revenue collections for the month of August, 2026
❯❯
Maximize Maximize Maximize
0 / 200
Expand Note
Add to Folder

No Folders have been created

+

Are you sure you want to delete "My most important" ?

NOTE:

News
Showing Results for :
Reset Filters
Results Found:
Show All Summaries Hide All Summaries
September 2, 2026
Show AI Summary
Data centre ease-of-doing-business reforms target reliable power, prepared land, streamlined approvals and building standards for faster infrastructure deployment.
Ease-of-doing-business reforms for India's data-centre ecosystem focus on faster and sustainable infrastructure deployment through reliable power, ready-to-use land, streamlined approvals and suitable building regulations. Proposed power measures include cluster-based transmission planning, first-day sanctioned load, dual feeders and cross-border renewable-energy procurement. Data-centre-ready land banks and power-ready parcels are intended to reduce development timelines. The National Building Code 2026 recognises data centres under Group E and contains a dedicated annex on fire-risk assessment and data-centre-specific performance indicators.
September 2, 2026
Show AI Summary
Trade facilitation and customs cooperation drive follow-up action on connectivity, regulatory coordination, investment promotion and bilateral commercial engagement.
India-Afghanistan bilateral trade and economic cooperation is being advanced through institutional engagement on trade facilitation, customs cooperation, connectivity, investment and commercial exchange. Priority areas include customs and data-sharing cooperation, visa facilitation for traders, banking and financial cooperation, pharmaceutical and agricultural trade, energy cooperation, tariff concessions, cargo connectivity and port-related matters. Follow-up action covers regulatory cooperation, improved connectivity, investment promotion and business-to-business engagement.
September 2, 2026
Show AI Summary
Residential rooftop solar subsidy requires eligibility, prior approval, registered installation, net metering, commissioning, and verified bank details for direct transfer.
PM Surya Ghar Muft Bijli Yojana provides central financial assistance for eligible grid-connected residential rooftop solar systems, capped at Rs. 78,000 for systems of three kilowatts or more. Applicants must be Indian citizens who own a suitable house, hold a valid electricity connection, and have not received an earlier solar-panel subsidy. Applications require portal registration, distribution-company feasibility approval, installation through a registered vendor, net metering, inspection, commissioning and submission of bank details. Assistance is transferred directly after verification. State-specific net-metering procedures, approvals and additional incentives may apply.
September 2, 2026
Show AI Summary
Sovereign credit rating upgrade reflects solid growth, stronger financial systems, and improving fiscal and external resilience.
JCR upgrades India's foreign-currency and local-currency long-term issuer ratings to A- with a stable outlook, citing sustained economic growth, productivity-oriented policies and improved financial-system soundness. Fiscal constraints include elevated deficits, intergovernmental fiscal transfers, electoral-cycle sensitivity, and high combined government debt and interest burdens. Greater emphasis on infrastructure capital expenditure has improved the quality of fiscal spending. External resilience is supported by a contained current account deficit, services surplus and foreign-exchange reserves exceeding short-term external debt.
September 2, 2026
Show AI Summary
Personal insolvency bench constitution and repayment-plan eligibility remain contested where a larger tribunal bench stays a third-member order.
Personal insolvency proceedings raised a challenge to the National Company Law Tribunal's authority to constitute a five-member bench after a split verdict. The challenge contended that the mechanism for differing views permits reference to another member or members, but does not authorise a five-member bench. The larger bench stayed the third member's order, restricted asset alienation, and suspended an order permitting settlement of personal-guarantee claims. The dispute concerned the validity of that bench, the split-verdict reference procedure, repayment-plan eligibility, and pending creditor appeals.
September 2, 2026
Show AI Summary
Digital lending app verification enables borrowers to identify regulated lenders, grievance channels, and warning signs before accepting loans.
GoCredit's Loan App Checker allows borrowers to search lending apps against the public Digital Lending App directory and identify the regulated lender, grievance contact and RBI Ombudsman escalation route where a match exists. Regulatory reporting by regulated entities enables app-level verification, while borrowers should also check the lender named in app disclosures and loan agreements. A directory listing is a regulated-entity disclosure, not RBI approval or endorsement. Unmatched apps should be assessed through verification steps and reported through official channels where appropriate.
September 2, 2026
Show AI Summary
Rupee depreciation in early trade reflected oil-price pressures, risk aversion, higher Treasury yields and broad dollar strength.
Early foreign-exchange trading saw the rupee weaken against the US dollar amid renewed US-Iran tensions, risk aversion, higher Brent crude prices, and a stronger dollar. Safe-haven demand, inflation concerns linked to potential oil-supply disruption, expectations of a September Federal Reserve rate increase, and higher US Treasury yields supported the broad dollar rally. RBI monitoring of the rupee's decline was noted.
September 2, 2026
Show AI Summary
Responsible AI governance requires ethical safeguards, privacy protection, accountability and adaptive oversight to build lasting corporate stakeholder trust.
Responsible artificial intelligence governance requires continuous innovation, inclusive development, responsible deployment and trust-based governance. AI systems should be ethical, safe, transparent, fair and human-centric, with safeguards for privacy, bias, security and accountability. Proportionate and adaptive regulation should provide clear accountability, standards, monitoring, auditability and grievance redressal. Good governance, cybersecurity, personal data protection and responsible AI together strengthen organisational resilience, stakeholder trust, transparency and sustainable innovation.
September 2, 2026
Show AI Summary
E-auction of surplus public land enables transparent outright sale of RINL parcels through registered, KYC-verified bidding.
National Land Monetization Corporation will facilitate the e-auction and outright sale of 459 encumbrance-free RINL land parcels, including residential plots and parcels suited for commercial and logistics use. Competitive bidding will occur through the RailTel E-Nivida e-procurement platform. Participation requires online registration, KYC verification, and plot-wise submission of an earnest money deposit within prescribed timelines. The process supports transparent monetisation of surplus land and non-core public assets.
September 2, 2026
Show AI Summary
Competition approval for infrastructure finance restructuring covers acquisition, minority transfer, investment divestment, and merger of regulated NBFCs.
Competition Commission of India approval applies to the acquisition of Aseem Infrastructure Finance Limited by TPG Nicobar SG Pte. Ltd., a subsequent minority share acquisition by ICICI Bank Limited, and Aseem's divestment of its shareholding in NIIF Infrastructure Finance Limited to National Investment and Infrastructure Fund II. Following the acquisition, Climate Finance India Private Limited is intended to merge into Aseem as the surviving entity. The entities involved include RBI-registered non-deposit taking NBFCs operating in infrastructure finance, investment and credit, and infrastructure debt financing.
September 2, 2026
Show AI Summary
Healthcare merger approval enables KCIL to acquire fertility and specialty hospital businesses alongside related equity issuances and investment.
Competition Commission approval covers KCIL's acquisition of up to 100% equity shareholding in AFCPL and 100% equity shareholding in ASHPL. The combination includes KCIL issuing equity shares and optionally convertible debentures to AHLL, representing 9.9% fully diluted shareholding as partial consideration, together with a further KCIL equity investment by Arvon Investments Pte. Ltd. KCIL operates mother and baby care hospitals, while AFCPL provides assisted reproductive treatment and reproductive-medicine services.
September 1, 2026
Show AI Summary
Money-laundering investigation into alleged District Mineral Fund diversion examines purported liaison activity and asset acquisition through proceeds of crime.
Money-laundering proceedings under the Prevention of Money Laundering Act concern alleged diversion of District Mineral Fund resources through the Chhattisgarh Seed Corporation. The investigation alleges siphoning of public funds by contractors in collusion with government officials and political executives. A businessman was identified as an alleged liaisoner and financial coordinator between public servants, district authorities and private vendors. Allegations also include receipt of commissions, acquisition of immovable assets from purported proceeds of crime, non-production of records, and contradictory statements during questioning.
September 1, 2026
Show AI Summary
Foreign exchange market dynamics: rupee appreciation reflected portfolio inflows, domestic growth, and possible central-bank intervention amid external pressures.
The rupee appreciated against the US dollar, supported by domestic growth, controlled fiscal slippage, portfolio-related inflows and possible Reserve Bank of India intervention. Its gains were limited by weak equity markets, rising crude oil prices and a stronger dollar. External geopolitical tensions and hawkish US monetary signals remained potential pressures. Domestic indicators showed strong economic activity, while the current account deficit widened because of a higher merchandise trade deficit. Foreign portfolio inflows continued despite investors remaining net sellers during the year.
September 1, 2026
Show AI Summary
Current account deficit widened as merchandise trade deficit increased, notwithstanding stronger services receipts, remittances, and foreign direct investment inflows.
India's current account deficit widened in the first quarter of 2026-27 as the merchandise trade deficit increased. Higher net services receipts, increased personal transfer receipts and lower net primary-income outgo partly supported the external account. Financial-account movements included higher net foreign direct investment inflows, a shift in foreign portfolio investment from net inflow to net outflow, and lower net inflows through non-resident deposits and external commercial borrowings. Foreign exchange reserves declined on a balance-of-payments basis during the quarter.
September 1, 2026
Show AI Summary
Technology-enabled tax compliance and enforcement supported higher commercial tax collections, while GST rate reductions moderated sectoral net GST growth.
Technology-enabled tax administration supported commercial tax and net GST collection growth in Andhra Pradesh during August 2026 and the cumulative period through August. AI-based analytics and scrutiny, IGST reversals, UPI-based enforcement, registration verification, Aadhaar authentication, digital payment enablement, predictive analytics and data sharing strengthened compliance, scrutiny and revenue mobilisation. Petroleum VAT, professional tax, liquor VAT and IGST settlement also increased, while GST rate reductions moderated net GST performance in specified product sectors.
September 1, 2026
Show AI Summary
Windfall gains tax on petroleum exports rises for petrol and diesel while aviation turbine fuel levy is reduced.
Special additional excise duty and road and infrastructure cess on petroleum-product exports are revised with effect from 1 September 2026. The export duty on diesel is increased, the levy on aviation turbine fuel is marginally reduced, and a duty is imposed on petrol exports. Existing duty rates for petrol and diesel cleared for domestic consumption remain unchanged. The windfall-tax framework seeks to support domestic fuel availability and deter exporters from benefiting from domestic and international price differences.
September 1, 2026
Show AI Summary
Automated Free Sale and Commerce Certificate issuance reduces manual scrutiny while preserving risk-based review for eligible exporters.
DGFT has enabled automated issuance of Free Sale and Commerce Certificates through its portal for eligible exporters of items not covered by the Drugs & Cosmetics Act, 1940. Applications satisfying prevailing framework and automated processing parameters may be issued without manual scrutiny. Applications requiring verification or not meeting those parameters may be routed for manual processing, while auto-approved applications may be flagged later for risk-based review. The mechanism seeks faster, more transparent and predictable processing while retaining necessary oversight.
September 1, 2026
Show AI Summary
Five-day banking and equitable performance incentives drive planned nationwide bank union strike amid unresolved pension demands.
United Forum of Bank Unions has proposed nationwide strike action over delayed five-day banking, the performance-linked incentive framework, and unresolved pension demands. Five-day banking was agreed under the 12th Bipartite Settlement/9th Joint Note with extended Monday-to-Friday working hours, but remains pending for implementation. Unions challenge the incentive scheme for departing from a uniform, bank-performance-linked approach and for disproportionately benefiting senior officers. The dispute is under conciliation and pending before the Delhi High Court, while pension updation, a uniform dearness allowance formula, and an old pension scheme option remain unresolved.
September 1, 2026
Show AI Summary
Equity market volatility intensified as higher crude prices, geopolitical tensions and tighter monetary expectations weakened domestic investor sentiment.
Indian equity markets closed marginally lower as higher crude oil prices, US-Iran tensions, and expectations of prolonged tight United States monetary policy weakened risk appetite. The phased Closing Auction Session contributed to a late recovery in the benchmark index. Rising crude prices and global bond yields triggered broad-based selling across several domestic sectors, while foreign institutional equity sales and weakness in overseas markets added to pressure despite stronger-than-expected domestic economic growth.
September 1, 2026
Show AI Summary
GST revenue collections show higher gross and net receipts alongside increased refunds and state-level settlement data.
GST revenue collections for August 2026 recorded total gross GST revenue of Rs. 1,99,853 crore, reflecting 14.8% growth over August 2025. Total refunds were Rs. 31,795 crore, including domestic refunds and export IGST refunds processed through ICEGATE. After adjustment of refunds, total net GST revenue was Rs. 1,68,057 crore, representing 8.3% growth. SGST collections and the SGST component of IGST settlement were separately identified for States and Union Territories, with post-settlement SGST aggregating Rs. 95,531 crore.

News

Back

All News

Showing Results for :
Reset Filters
No Records Found

News

Showing Results for : Reset Filters
Customs, DGFT & SEZ

INDIA’S FOREIGN TRADE: December 2021

January 14, 2022

Contents
Summary
Note

Note

-

Bookmark

Print

Print

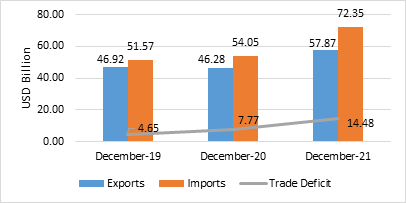
India’s overall exports (Merchandise and Services combined) in December 2021* are estimated to be USD 57.87 Billion, exhibiting a positive growth of 25.05 per cent over the same period last year and a positive growth of 23.35 per cent over December 2019. Overall imports in December 2021* are estimated to be USD 72.35 Billion, exhibiting a positive growth of 33.86 per cent over the same period last year and a positive growth of 40.30 per cent over December 2019

Table 1: Trade during December 2021*


December 2021

(USD Billion)

December 2020

(USD Billion)

December 2019

(USD Billion)

Growth vis-à-vis December 2020 (%)

Growth vis-à-vis December 2019 (%)

Merchandise

Exports

37.81

27.22

27.11

38.91

39.47

Imports

59.48

42.93

39.59

38.55

50.24

Trade Balance

-21.68

-15.72

-12.49

-37.92

-73.61

Services*

Exports

20.07

19.06

19.81

5.26

1.29

Imports

12.87

11.12

11.98

15.76

7.44

Net of Services

7.20

7.95

7.84

-9.42

-8.12

Overall Trade (Merchandise+

Services)*

Exports

57.87

46.28

46.92

25.05

23.35

Imports

72.35

54.05

51.57

33.86

40.30

Trade Balance

-14.48

-7.77

-4.65

-86.32

-211.26

* Note: The latest data for services sector released by RBI is for November 2021. The data for December 2021 is an estimation, which will be revised based on RBI’s subsequent release. (ii) Data for 2019, 2020 and April to September 2021 are revised on pro-rata basis using quarterly balance of payments data.

Fig 1: Overall Trade during December 2021*
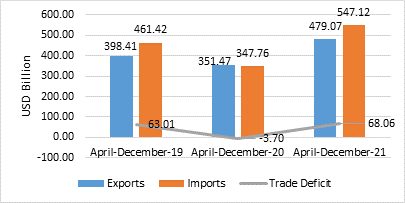
India’s overall exports (Merchandise and Services combined) in April-December 2021* are estimated to be USD 479.07 Billion, exhibiting a positive growth of 36.31 per cent over the same period last year and a positive growth of 20.25 per cent over April-December 2019. Overall imports in April-December 2021* are estimated to be USD 547.12 Billion, exhibiting a positive growth of 57.33 per cent over the same period last year and a positive growth of 18.57 per cent over April-December 2019.

Table 2: Trade during April-December 2021*


April-December 2021

(USD Billion)

April-December 2020

(USD Billion)

April-December 2019

(USD Billion)

Growth vis-à-vis April-December 2020 (%)

Growth vis-à-vis April-December 2019 (%)

Merchandise

Exports

301.38

201.38

238.27

49.66

26.49

Imports

443.82

262.76

364.18

68.91

21.87

Trade Balance

-142.44

-61.38

-125.91

-132.07

-13.13

Services*

Exports

177.68

150.09

160.13

18.39

10.96

Imports

103.30

85.00

97.24

21.52

6.23

Net of Services

74.39

65.08

62.90

14.30

18.27

Overall Trade (Merchandise+

Services)*

Exports

479.07

351.47

398.41

36.31

20.25

Imports

547.12

347.76

461.42

57.33

18.57

Trade Balance

-68.06

3.70

-63.01

-1937.96

-8.00

* Note: The latest data for services sector released by RBI is for November 2021. The data for December 2021 is an estimation, which will be revised based on RBI’s subsequent release. (ii) Data for 2019, 2020 and April to September 2021 are revised on pro-rata basis using quarterly balance of payments data.

Fig 2: Overall Trade during April-December 2021*
MERCHANDISE TRADE

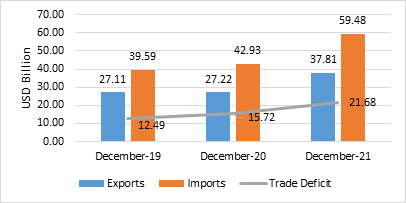
  • Merchandise exports in December 2021 were USD 37.81 Billion, as compared to USD 27.22 Billion in December 2020, exhibiting a positive growth of 38.91 per cent. As compared to December 2019, exports in December 2021 exhibited a positive growth of 39.47 per cent.
  • Merchandise imports in December 2021 were USD 59.48 Billion, which is an increase of 38.55 per cent over imports of USD 42.93 Billion in December 2020. Imports in December 2021 have registered a positive growth of 50.24 per cent in comparison to December 2019.
  • The merchandise trade balance for December 2021 was estimated at USD (-)  21.68 Billion as against USD (-) 15.72 Billion in December 2020, which is a decline of (-) 37.92 per cent. As compared to December 2019 (USD (-) 12.49 Billion), trade balance in December 2021 exhibited a negative growth of (-) 73.61 per cent.


Fig 3: Merchandise Trade during December 2021
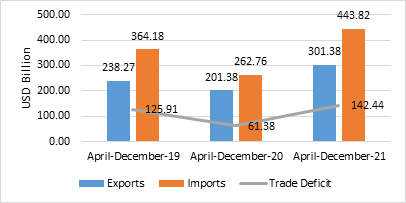
  • Merchandise exports for the period April-December 2021 was USD 301.38 Billion as against USD 201.38 Billion during the period April-December 2020, registering a positive growth of 49.66 per cent. As compared to April-December 2019, exports in April-December 2021 exhibited a positive growth of 26.49 per cent.
  • Merchandise imports for the period April-December 2021 was USD 443.82 Billion as against USD 262.76 Billion during the period April-December 2020, registering a positive growth of 68.91 per cent. Imports in April-December 2021 have registered a positive growth of 21.87 per cent in comparison to April-December 2019.
  • The merchandise trade balance for April-December 2021 was estimated at USD (-) 142.44 Billion as against USD (-) 61.38 Billion in April-December 2020, which is a decline of (-) 132.07 per cent. As compared to April-December 2019 (USD (-) 125.91 Billion), trade balance in April-December 2021 exhibited a negative growth of (-) 13.13 per cent.

Fig 4: Merchandise Trade during April- December 2021
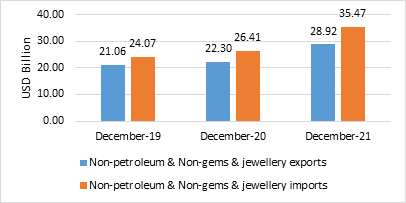
  • Non-petroleum and non-gems & jewellery exports in December 2021 were USD 28.92 Billion, registering a positive growth of 29.67 per cent over non-petroleum and non-gems & jewellery exports of USD 22.30 Billion in December 2020 and a positive growth of 37.31 per cent over non-petroleum and non-gems & jewellery exports of USD 21.06 Billion in December 2019. 
  • Non-petroleum, non-gems & jewellery (gold, silver & precious metals) imports were USD 35.47 Billion in December 2021 with a positive growth of 34.28 per cent over Non-petroleum, non-gems & jewellery imports of USD 26.41 Billion in December 2020 and a positive growth of 47.32 per cent over Non-petroleum, non-gems & jewellery imports of USD 24.07 Billion in December 2019.

Table 3: Trade excluding Petroleum and Gems & Jewellery during December 2021


December 2021

(USD Billion)

December 2020

(USD Billion)

December 2019

(USD Billion)

Growth vis-à-vis December 2020 (%)

Growth vis-à-vis December 2019 (%)

Non- petroleum exports

31.92

24.88

23.48

28.29

35.97

Non- petroleum imports

43.32

33.31

28.88

30.07

50.02

Non-petroleum & Non Gems & Jewellery exports

28.92

22.30

21.06

29.67

37.31

Non-petroleum & Non Gems & Jewellery imports*

35.47

26.41

24.07

34.28

47.32

Note: Gems & Jewellery Imports include Gold, Silver & Pearls, precious & Semi-precious stones

Fig 5: Trade excluding Petroleum and Gems & Jewellery during December 2021
 

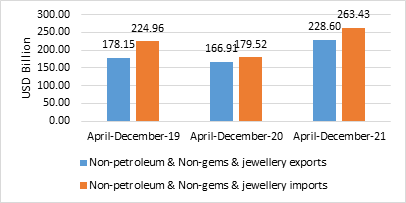
  • Non-petroleum and non-gems & jewellery exports during April-December 2021 was USD 228.60 Billion, an increase of 36.96 per cent over non-petroleum and non-gems & jewellery exports of USD 166.91 Billion in April-December 2020 and an increase of 28.32 per cent over non-petroleum and non-gems & jewellery exports of USD 178.15 Billion in April-December 2019.
  • Non-petroleum, non-gems & jewellery (gold, silver & precious metals) imports were USD 263.43 Billion in April-December 2021, recording a positive growth of 46.74 per cent, as compared to Non-petroleum, non-gems & jewellery imports of USD 179.52 Billion in April-December 2020 and a positive growth of 17.10 per cent over USD 224.96 Billion in April-December 2019.

Table 4: Trade excluding Petroleum and Gems & Jewellery during April-December 2021


April-December 2021

(USD Billion)

April-December 2020

(USD Billion)

April-December 2019

(USD Billion)

Growth vis-à-vis April-December 2020 (%)

Growth vis-à-vis April-December 2019 (%)

Non- petroleum exports

257.50

183.79

206.13

40.11

24.92

Non- petroleum imports

325.56

208.80

267.47

55.92

21.72

Non-petroleum & Non Gems & Jewellery exports

228.60

166.91

178.15

36.96

28.32

Non-petroleum & Non Gems & Jewellery imports*

263.43

179.52

224.96

46.74

17.10

Note: Gems & Jewellery Imports include Gold, Silver & Pearls, precious & Semi-precious stones

Fig 6: Trade excluding Petroleum and Gems & Jewellery during April-December 2021
SERVICES TRADE

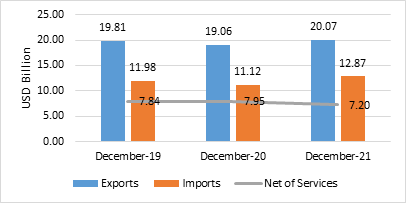
  • The estimated value of services export for December 2021* is USD 20.07 Billion, exhibiting a positive growth of 5.26 per cent vis-a-vis December 2020 (USD 19.06 Billion) and a positive growth of 1.29 per cent vis-à-vis December 2019 (USD 19.81 Billion).
  • The estimated value of services import for December 2021* is USD 12.87 Billion exhibiting a positive growth of 15.76 per cent vis-à-vis December 2020 (USD 11.12 Billion) and a positive growth of 7.44 per cent vis-à-vis December 2019 (USD 11.98 Billion).
  • The services trade balance in December 2021* is estimated at USD 7.20 Billion, which is a decline of (-) 9.42 per cent over December 2020 (USD 7.95 Billion) and a decline of (-) 8.12 per cent over December 2019 (USD 7.84 Billion).

Fig 7: Services Trade during December 2021*
  • The estimated value of services export for April-December 2021* is USD 177.68 Billion, exhibiting a positive growth of 18.39 per cent vis-a-vis April-December 2020 (USD 150.09 Billion) and a positive growth of 10.96 per cent vis-à-vis April-December 2019 (USD 160.13 Billion).
  • The estimated value of services imports for April-December 2021* is USD 103.30 Billion exhibiting a positive growth of 21.52 per cent vis-à-vis April-December 2020 (USD 85.00 Billion) and a positive growth of 6.23 per cent vis-à-vis April-December 2019 (USD 97.24 Billion).
  • The services trade balance for April-December 2021* was estimated at USD 74.39 Billion as against USD 65.08 Billion in April-December 2020, which is an increase of 14.30 per cent. As compared to April-December 2019 (USD 62.90 Billion), net of services in April-December 2021* exhibited a positive growth of 18.27 per cent. 

Fig 8: Services Trade during April-December 2021*
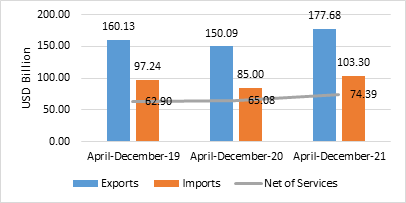
 

Table 5: Export Growth in Commodity Groups in December 2021

Sl. No.

Commodities

(Values in Million USD)

% Change

DEC'20

DEC'21

DEC'21


Commodity groups exhibiting positive growth

1

Petroleum Products

2336.63

5887.67

151.97

2

Coffee

44.00

98.47

123.80

3

Mica, Coal & Other Ores, Minerals including processed minerals

337.08

539.23

59.97

4

Plastic & Linoleum

570.49

899.85

57.73

5

Cotton Yarn/Fabs./made-ups, Handloom Products etc.

987.76

1443.98

46.19

6

Other cereals

96.24

140.17

45.65

7

Engineering Goods

7072.63

9788.88

38.41

8

Man-made Yarn/Fabs./made-ups etc.

380.52

518.22

36.19

9

Electronic Goods

1248.33

1672.59

33.99

10

Rice

682.77

895.08

31.10

11

Marine Products

562.85

720.51

28.01

12

Organic & Inorganic Chemicals

2100.00

2664.15

26.86

13

RMG of all Textiles

1195.78

1466.43

22.63

14

Fruits & Vegetables

190.07

227.53

19.71

15

Leather & leather products

338.49

404.41

19.48

16

Meat, dairy & poultry products

335.53

396.89

18.29

17

Gems & Jewellery

2575.67

2997.44

16.38

18

Oil seeds

147.72

165.29

11.90

19

Jute Mfg. including Floor Covering

41.78

46.73

11.86

20

Handicrafts excl. handmade carpet

180.34

196.13

8.75

21

Cereal preparations & miscellaneous processed items

183.48

199.18

8.56

22

Carpet

156.08

166.14

6.45

23

Drugs & Pharmaceuticals

2203.53

2318.04

5.20

Sl. No.

Commodities

(Values in Million USD)

% Change

DEC'20

DEC'21

DEC'21


Commodity Groups exhibiting negative growth

24

Iron Ore

382.38

54.44

-85.76

25

Oil Meals

236.75

119.67

-49.45

26

Cashew

52.29

39.09

-25.24

27

Spices

344.92

314.40

-8.85

28

Tea

74.43

68.61

-7.82

29

Ceramic products & glassware

310.62

294.23

-5.28

30

Tobacco

82.88

82.13

-0.90

 Table 6: Import Growth in Commodity Groups in December 2021

Sl. No.

Commodities

(Values in Million USD)

% Change

DEC'20

DEC'21

DEC'21


Commodity Groups exhibiting positive growth

1

Silver

10.39

232.04

2133.30

2

Sulphur & Unroasted Iron Pyrites

19.69

69.95

255.26

3

Fertilisers, Crude & manufactured

632.38

1712.03

170.73

4

Newsprint

12.07

27.18

125.19

5

Pulp and Waste paper

75.53

164.25

117.46

6

Metaliferrous ores & other minerals

429.52

857.30

99.59

7

Organic & Inorganic Chemicals

1879.88

3253.17

73.05

8

Coal, Coke & Briquettes, etc.

1624.32

2803.09

72.57

9

Cotton Raw & Waste

30.58

52.73

72.43

10

Project goods

127.03

215.58

69.71

11

Petroleum, Crude & products

9629.01

16165.97

67.89

12

Leather & leather products

50.02

76.08

52.10

13

Vegetable Oil

1210.88

1827.33

50.91

14

Dyeing/tanning/colouring materials

281.04

402.57

43.24

15

Artificial resins, plastic materials, etc.

1434.57

1970.30

37.34

16

Iron & Steel

1265.30

1722.90

36.17

17

Non-ferrous metals

1303.56

1705.32

30.82

18

Electronic goods

5037.69

6427.30

27.58

19

Fruits & vegetables

240.36

305.64

27.16

20

Textile yarn Fabric, made-up articles

180.93

229.20

26.68

21

Pearls, precious & Semi-precious stones

2397.17

2891.13

20.61

22

Machinery, electrical & non-electrical

3149.33

3796.75

20.56

23

Medicinal & Pharmaceutical products

623.44

743.89

19.32

24

Wood &  Wood products

470.32

548.23

16.57

25

Professional instrument, Optical goods, etc.

467.38

511.74

9.49

26

Chemical material & products

876.78

942.36

7.48

27

Gold

4485.76

4729.47

5.43

28

Machine tools

347.52

363.26

4.53

Sl. No.

Commodities

(Values in Million USD)

% Change

DEC'20

DEC'21

DEC'21


Commodity Groups exhibiting negative growth

29

Pulses

294.61

189.65

-35.63

30

Transport equipment

2476.59

2306.43

-6.87

  Table 7: MERCHANDISE TRADE 

EXPORTS & IMPORTS: (Rs. Crore)

(PROVISIONAL)


DECEMBER

APRIL-DECEMBER

EXPORTS(including re-exports)


2019-20

1,92,984.47

16,77,370.97

2020-21

2,00,294.50

15,00,019.98

2021-22

2,84,960.74

22,38,821.02

%Growth 2021-22/ 2020-21

42.27

49.25

%Growth 2021-22/ 2019-20

47.66

33.47

IMPORTS


2019-20

2,81,880.86

25,62,539.91

2020-21

3,15,970.77

19,56,256.92

2021-22

4,48,352.86

32,98,494.98

%Growth 2021-22/ 2020-21

41.90

68.61

%Growth 2021-22/ 2019-20

59.06

28.72

TRADE BALANCE


2019-20

-88,896.39

-8,85,168.94

2020-21

-1,15,676.27

-4,56,236.94

2021-22

-1,63,392.12

-10,59,673.96

Table 8: SERVICES TRADE 

EXPORTS & IMPORTS (SERVICES) : (US $ Billion)


(PROVISIONAL)

November 2021

April-

November 2021

EXPORTS (Receipts)

20.14

157.62

IMPORTS (Payments)

12.59

90.43

TRADE BALANCE

7.55

67.19


EXPORTS & IMPORTS (SERVICES): (Rs. Crore)


(PROVISIONAL)

November 2021

April-

November 2021

EXPORTS (Receipts)

1,50,006.15

11,68,297.72

IMPORTS (Payments)

93,753.85

6,70,401.42


TRADE BALANCE

56,252.31

4,97,896.29

Source: RBI Press Release dated 4th January 2022


 * Link for quick estimates

***

Topics

Acts Income Tax
