

Loading...

Top
Help
×

By creating an account you can:

Logo TaxTMI
Call Us / Help / Feedback

Contact Us At :

E-mail: [email protected]

Call / WhatsApp at: +91 99117 96707

For more information, Check Contact Us

FAQs :

To know Frequently Asked Questions, Check FAQs

Most Asked Video Tutorials :

For more tutorials, Check Video Tutorials

Submit Feedback/Suggestion :

Email :
Please provide your email address so we can follow up on your feedback.
Category :
Description :
Min 15 characters 0/2000
Make Most of Text Search
  1. Checkout this video tutorial: How to search effectively on TaxTMI.
  2. Put words in double quotes for exact word search, eg: "income tax"
  3. Avoid noise words such as : 'and, of, the, a'
  4. Sort by Relevance to get the most relevant document.
  5. Press Enter to add multiple terms/multiple phrases, and then click on Search to Search.
  6. Text Search
  7. The system will try to fetch results that contains ALL your words.
  8. Once you add keywords, you'll see a new 'Search In' filter that makes your results even more precise.
  9. Text Search
Add to...
You have not created any category. Kindly create one to bookmark this item!
Create New Category
Hide
Title :
Description :
❮❮ Hide
Default View
Expand ❯❯
Close ✕
🔎 News - Adv. Search
TEXT SEARCH:

Press 'Enter' to add multiple search terms. Rules for Better Search

Search In:
Main Text + AI Text
  • Main Text
  • Main Text + AI Text
  • AI Text
Category: ?
Categorized by AI
---- All Categories ----
  • ---- All Categories ----
  • Income Tax
  • GST
  • Customs, DGFT & SEZ
  • FEMA & RBI
  • Corp. Laws, SEBI & IBC
  • PMLA, Black Money & ED
  • Budget
  • News and Press Release
  • PTI News
Month:
---- All Months ----
  • ---- All Months ----
  • January
  • February
  • March
  • April
  • May
  • June
  • July
  • August
  • September
  • October
  • November
  • December
Year:
---- All Years ----
  • ---- All Years ----
  • 2026
  • 2025
  • 2024
  • 2023
  • 2022
  • 2021
  • 2020
  • 2019
  • 2018
  • 2017
  • 2016
  • 2015
  • 2014
  • 2013
  • 2012
  • 2011
Sort By: ?
In Sort By 'Default', exact matches for text search are shown at the top, followed by the remaining results in their regular order.
Relevance Default Date
    ED raids multiple locations in Kolkata in bank loan fraud case
    Commerce & Industry Minister Shri Piyush Goyal Calls Upon Auto Component Industry To Go Global
    18th Meeting of Heads of IP Offices of BRICS Countries Held in New Delhi
    India’s Sovereign Credit Rating upgraded to 'A-' with Stable Outlook by Japan Credit Rating Agency
    Secretary, DFS Chairs Review Meeting on Financial and Business Performance of Public Sector General Insurance Companies (PSGICs)
    GIFT IFSC emerges as a strong and vibrant international banking hub, mobilises over $52.8 billion under RBI’s FCNR(B) Swap Facility, $11.62 bn in EC...
    Ex-CII executive Shuchita Sonalika appointed COO of Canada-India Business Council
    India's 7.8% growth despite global disruptions remarkable: FM Sitharaman at investors meet in US
    After 35 years, India's sovereign rating upgraded to 'A-' by JCR on solid growth, resilient financial system
    Rupee rises 22 paise to close at 94.73 against US dollar
    India draws record USD 127 bn forex deposit in special drive
    Banks mobilise USD 127.23 billion in deposits from Indian diaspora: RBI
    CBI Arrests CGST Additional Commissioner and Two others in Rs. 40 Lakh Bribery Case in Raigad, Maharashtra
    Haryana: SGST collections grow 29 pc in first 5 months of 2026-27
    Lokta Opens Its Agentic Loan Servicing Platform to NBFCs Up to Rs 100 crore, with No Platform Fee for Up to Two Years
    RTI seeks Aadhaar date-of-birth changes after pre-poll Bihar pension hike; UIDAI says no such data
    IC Electricals Secures Approx. ₹6 Crore Railway Orders and ₹1 Crore Export Order
    Additional Information related to GDP Estimates Received After Release of Q1 Estimates of FY 2026-27
    Union Minister of Commerce & Industry Shri Piyush Goyal Chairs CEO Roundtable on Ease of Doing Business for Scaling India’s Data Centre Ecosystem
❯❯
Maximize Maximize Maximize
0 / 200
Expand Note
Add to Folder

No Folders have been created

+

Are you sure you want to delete "My most important" ?

NOTE:

News
Showing Results for :
Reset Filters
Results Found:
Show All Summaries Hide All Summaries
September 3, 2026
Show AI Summary
Money laundering investigation examines alleged diversion of bank loans from a power project to group entities and personal use.
Money laundering investigation under the Prevention of Money Laundering Act concerns alleged diversion of bank loans obtained by Kohinoor Power for a power plant in Jharkhand. The loan proceeds were allegedly transferred to other group entities and used personally. Searches were conducted at eleven premises associated with the group's promoters, directors and auditors. The company entered liquidation proceedings before the National Company Law Tribunal, with limited recovery for creditors.
September 3, 2026
Show AI Summary
Globalisation of auto component manufacturing is linked to trade access, resilient supply chains, technology adoption, safety, and vehicle scrappage.
The auto component industry is encouraged to expand globally through reciprocal market access, overseas manufacturing, international investment and trade partnerships. Supply-chain resilience is to be strengthened through indigenisation of vulnerable products, access to critical minerals, and domestic capacity in auto components, speciality steel, technical textiles and semiconductors. Priority is also given to high-value integrated solutions, artificial intelligence-enabled quality control, vehicle safety and industrial parks offering manufacturing infrastructure. Vehicle scrappage requires coordinated government incentives and fair industry valuation to support replacement demand for new-age vehicles.
September 3, 2026
Show AI Summary
Updated IP cooperation guidelines strengthen cross-border innovation, patent examination coordination, traditional knowledge protection, and geographical indication commercialisation.
IP BRICS Heads adopted Updated Operational Guidelines to direct result-oriented intellectual property cooperation, promote cross-border innovation, and reinforce joint engagement in global IP standards. Priority areas include protection of traditional knowledge and traditional systems of medicine, reinforced patent examination cooperation, exchange of search results, patent analytics, and geographical indication protection and commercialisation. Coordination mechanisms and periodic progress reviews are emphasised for effective implementation and continuity of cooperation.
September 3, 2026
Show AI Summary
Sovereign credit rating upgrade reflects resilient growth, improved fiscal expenditure quality, stronger financial systems, and a robust external position.
India's long-term foreign-currency and local-currency issuer ratings were upgraded from 'BBB+' to 'A-', with a Stable Outlook, reflecting resilient economic growth, improved fiscal expenditure quality, strengthened financial-sector soundness, and a robust external position. Fiscal improvement is linked to greater capital expenditure and lower fiscal deficit. Financial resilience is supported by improved banking and non-banking sector asset quality and capital adequacy. External strength arises from a contained current account deficit, services surplus, and foreign-exchange reserves exceeding short-term external debt.
September 3, 2026
Show AI Summary
Public sector general insurance performance requires profitable underwriting, lower claim ratios, digitalisation, standardised monitoring, and quality grievance redressal.
Public Sector General Insurance Companies were advised to focus on profitable business lines, reduce the Incurred Claim Ratio, and accelerate technology use and digitalisation while optimising related expenditure. They are to improve insurance penetration, density, outreach and customer awareness, particularly in underserved segments, while reducing protection gaps. A robust, standardised KPI framework should enable comparable financial and non-financial performance assessment and be reviewed quarterly. Customer grievances require expeditious and quality redressal.
September 3, 2026
Show AI Summary
Cross-border financing through GIFT-IFSC expands foreign currency mobilisation, external commercial borrowing disbursements, and international bond market access.
GIFT-IFSC's IBUs mobilised foreign-currency liquidity under the RBI's FCNR(B) deposit swap facility, with 20 IBUs sanctioning USD 54.02 billion and disbursing approximately USD 52.82 billion as at 31 August 2026. Between April and August 2026, IBUs disbursed USD 11.62 billion in External Commercial Borrowings, while Indian banks raised USD 11.12 billion through bond listings on IFSC exchanges. These activities support cross-border financing, international capital-market access and foreign-exchange inflows.
September 3, 2026
Show AI Summary
Bilateral business council leadership appointment strengthens operational capacity to advance Canada-India economic and investment partnerships.
Operational leadership for bilateral economic engagement is strengthened through the appointment of Shuchita Sonalika as the first Chief Operating Officer of the Canada-India Business Council. The appointment is directed toward enhancing the council's capacity to support expanding investment and economic relations between Canada and India, in coordination with its board, members and partners. Sonalika brings international affairs experience in advancing India's economic partnerships across global markets.
September 3, 2026
Show AI Summary
Regulatory certainty and compliance reforms support investment facilitation, infrastructure development, MSME credit access, and reduction of bank non-performing assets.
Regulatory certainty, ease of compliance and investment facilitation are identified as central elements of India's economic reform orientation. The Insolvency and Bankruptcy Code is included among reforms supporting regulatory certainty, reduced paperwork and easier compliance. Policy priorities include infrastructure development, artificial intelligence and data centres, credit access for MSMEs, reduction of banks' non-performing assets, fiscal discipline, and investment facilitation by central and state governments.
September 2, 2026
Show AI Summary
Sovereign credit rating upgrade reflects resilient economic growth, fiscal quality, financial-system soundness, and external-sector resilience.
Japan Credit Rating Agency upgraded India's foreign-currency and local-currency long-term issuer ratings to A-, citing solid economic growth, strengthened growth-oriented policies and improved financial-system soundness. Improved banking asset quality, insolvency mechanisms, government capital infusion and stronger central-bank supervision support financial resilience. Fiscal quality has improved through greater infrastructure-focused capital expenditure and restraint in current spending, while a contained current-account deficit, services surplus and substantial foreign-exchange reserves support resilience to external shocks.
September 2, 2026
Show AI Summary
Currency-market intervention and foreign capital inflows supported rupee resilience amid higher crude prices and dollar strength.
Foreign capital inflows and modest foreign institutional equity purchases supported rupee appreciation against the US dollar despite weak domestic equities, elevated crude oil prices and a stronger dollar. RBI monitoring and apparent currency-market intervention supported the rupee amid risk aversion, higher US Treasury yields and concerns over crude supply disruptions. Forthcoming US employment data remained relevant to dollar and rupee direction.
September 2, 2026
Show AI Summary
Foreign-currency non-resident deposits bolster external liquidity through hedging support and lending flexibility during global market uncertainty.
Foreign Currency Non-Resident (Bank) [FCNR(B)] deposits are fixed-term foreign-currency deposits for non-resident Indians, with principal and interest repayable in the deposit currency and without direct rupee exchange-rate risk. A special central-bank programme mobilised substantial FCNR(B) deposits, alongside overseas foreign-currency borrowings and external commercial borrowings, to strengthen foreign-exchange liquidity. Banks received hedging-cost support and permission to lend against the deposits. The facility was closed earlier than scheduled after its mobilisation objective was met.
September 2, 2026
Show AI Summary
Foreign currency swap facility accelerated FCNR(B) deposit window closure after substantial diaspora inflows, while borrowing windows remain open.
Special USD-INR foreign-exchange swap facility for FCNR(B) deposits, Overseas Foreign Currency Borrowings and External Commercial Borrowings was introduced to strengthen the external sector and support foreign-exchange liquidity. FCNR(B) deposits, under which principal and interest are repayable in the same foreign currency, generated the principal share of inflows. Strong diaspora participation led to advancement of the FCNR(B) window closure. The swap facility for Overseas Foreign Currency Borrowings and External Commercial Borrowings remains open until December 31, 2026.
September 2, 2026
Show AI Summary
GST bribery allegations led to a trap operation against officials and an intermediary in a quarrying matter.
Criminal investigation concerns alleged solicitation and acceptance of an undue advantage by CGST officials in connection with settling a GST/royalty matter involving a stone-quarrying firm. The officials allegedly arranged for a private person to collect the payment. A trap operation resulted in the private person being caught while accepting the alleged undue advantage. Searches at the accused persons' premises led to recovery of cash and jewellery, while further investigation continues.
September 2, 2026
Show AI Summary
State GST collection growth outpaced national expansion during the first five months, alongside increased VAT and CST receipts.
Haryana's SGST collections increased by 29 per cent during April-August of financial year 2026-27, exceeding the national growth rate of 16 per cent. August 2026 post-settlement SGST revenue rose by 21 per cent, compared with national average growth of 13 per cent. Haryana accounted for less than 4 per cent of national GST taxpayers but contributed approximately 7.7 per cent of aggregate national SGST, CGST and IGST collections. VAT/CST collections rose by 13.8 per cent during the same period.
September 2, 2026
Show AI Summary
NBFC loan servicing governance retains lender control through deterministic decision rules, maker-checker controls, reconciled migration and optional AI assistance.
Lokta Next 100 offers RBI-registered NBFCs with loan books up to Rs 100 crore post-approval loan servicing, accounting, reporting, analytics, collections, recovery and partner-management functions, excluding pure-play microfinance NBFCs. Credit, approval and money decisions remain with the lender. Maker-checker approval applies to every change, and migration requires line-by-line reconciliation before cutover. Records remain lender-owned, hosted in India and exportable. AI may propose changes but cannot post to the ledger; deterministic lender-policy rules decide changes. Platform fees are deferred for up to 24 months, subject to stated loan-book thresholds.
September 2, 2026
Show AI Summary
RTI access to maintained records does not require creation of Aadhaar date-of-birth update data on demand.
UIDAI did not maintain separate Aadhaar data on date-of-birth updates in Bihar following the announced social security pension enhancement, including month-wise or district-wise compilations. No internal review or flagging of unusual update patterns was available or applicable in its records. The Central Information Commission clarified that the RTI framework does not require a public authority to create, compile or generate information that it does not maintain in the form requested. The initial CPIO response treating the information as outside the RTI Act was considered inappropriate.
September 2, 2026
Show AI Summary
Transgender arrest and detention safeguards prompt calls for a standard operating procedure and clearer procedural protections.
Legal and regulatory issues include safeguards for arrest and detention of transgender persons, consultation requirements in Bar Council policy-making, and procedural accountability in electoral administration and policing. Personal insolvency proceedings raise questions about tribunal powers to constitute an expanded bench. Hospitality operators are expected to comply strictly with food-safety and hygiene norms. Proposed restrictions on minors' social-media accounts address cyberbullying, online exploitation, and harmful screen exposure.
September 2, 2026
Show AI Summary
Railway equipment purchase orders and export order expand IC Electricals' domestic and international business pipeline.
IC Electricals Company Limited has secured railway purchase orders for electrical and electronic supplies and an export order, creating combined order inflow across domestic railway operations and international markets. Its product portfolio includes regulators, battery chargers, emergency lights, inverters, microprocessor-based control systems, alternators, traction motors, and permanent magnet alternators with controllers. Forward-looking statements on business plans, projects, and research and development remain subject to risks and uncertainties and may differ materially from actual results.
September 2, 2026
Show AI Summary
Double deflation explains negative manufacturing GVA deflators when input prices rise faster than output prices.
Double deflation in manufacturing separately deflates gross output and intermediate consumption, with real GVA derived from their difference. Where input prices rise faster than output prices, nominal GVA may grow more slowly than real GVA, producing a negative implicit GVA deflator despite rising output and input prices. A negative manufacturing GVA deflator therefore does not establish a fall in manufactured-product prices or lower real growth. The implicit GDP deflator is a derived ratio between current-price and constant-price GDP and differs from CPI and WPI because of their distinct coverage, weights, and price concepts.
September 2, 2026
Show AI Summary
Data centre ease-of-doing-business reforms target reliable power, prepared land, streamlined approvals and building standards for faster infrastructure deployment.
Ease-of-doing-business reforms for India's data-centre ecosystem focus on faster and sustainable infrastructure deployment through reliable power, ready-to-use land, streamlined approvals and suitable building regulations. Proposed power measures include cluster-based transmission planning, first-day sanctioned load, dual feeders and cross-border renewable-energy procurement. Data-centre-ready land banks and power-ready parcels are intended to reduce development timelines. The National Building Code 2026 recognises data centres under Group E and contains a dedicated annex on fire-risk assessment and data-centre-specific performance indicators.

News

Back

All News

Showing Results for :
Reset Filters
No Records Found

News

Showing Results for : Reset Filters
Customs, DGFT & SEZ

INDIA’S FOREIGN TRADE: December 2021

January 14, 2022

Contents
Summary
Note

Note

-

Bookmark

Print

Print

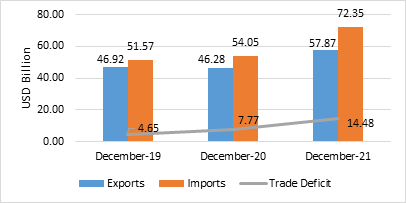
India’s overall exports (Merchandise and Services combined) in December 2021* are estimated to be USD 57.87 Billion, exhibiting a positive growth of 25.05 per cent over the same period last year and a positive growth of 23.35 per cent over December 2019. Overall imports in December 2021* are estimated to be USD 72.35 Billion, exhibiting a positive growth of 33.86 per cent over the same period last year and a positive growth of 40.30 per cent over December 2019

Table 1: Trade during December 2021*


December 2021

(USD Billion)

December 2020

(USD Billion)

December 2019

(USD Billion)

Growth vis-à-vis December 2020 (%)

Growth vis-à-vis December 2019 (%)

Merchandise

Exports

37.81

27.22

27.11

38.91

39.47

Imports

59.48

42.93

39.59

38.55

50.24

Trade Balance

-21.68

-15.72

-12.49

-37.92

-73.61

Services*

Exports

20.07

19.06

19.81

5.26

1.29

Imports

12.87

11.12

11.98

15.76

7.44

Net of Services

7.20

7.95

7.84

-9.42

-8.12

Overall Trade (Merchandise+

Services)*

Exports

57.87

46.28

46.92

25.05

23.35

Imports

72.35

54.05

51.57

33.86

40.30

Trade Balance

-14.48

-7.77

-4.65

-86.32

-211.26

* Note: The latest data for services sector released by RBI is for November 2021. The data for December 2021 is an estimation, which will be revised based on RBI’s subsequent release. (ii) Data for 2019, 2020 and April to September 2021 are revised on pro-rata basis using quarterly balance of payments data.

Fig 1: Overall Trade during December 2021*
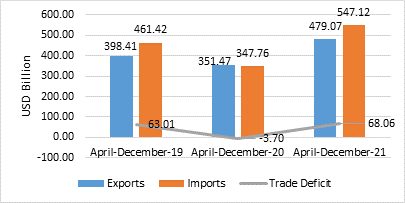
India’s overall exports (Merchandise and Services combined) in April-December 2021* are estimated to be USD 479.07 Billion, exhibiting a positive growth of 36.31 per cent over the same period last year and a positive growth of 20.25 per cent over April-December 2019. Overall imports in April-December 2021* are estimated to be USD 547.12 Billion, exhibiting a positive growth of 57.33 per cent over the same period last year and a positive growth of 18.57 per cent over April-December 2019.

Table 2: Trade during April-December 2021*


April-December 2021

(USD Billion)

April-December 2020

(USD Billion)

April-December 2019

(USD Billion)

Growth vis-à-vis April-December 2020 (%)

Growth vis-à-vis April-December 2019 (%)

Merchandise

Exports

301.38

201.38

238.27

49.66

26.49

Imports

443.82

262.76

364.18

68.91

21.87

Trade Balance

-142.44

-61.38

-125.91

-132.07

-13.13

Services*

Exports

177.68

150.09

160.13

18.39

10.96

Imports

103.30

85.00

97.24

21.52

6.23

Net of Services

74.39

65.08

62.90

14.30

18.27

Overall Trade (Merchandise+

Services)*

Exports

479.07

351.47

398.41

36.31

20.25

Imports

547.12

347.76

461.42

57.33

18.57

Trade Balance

-68.06

3.70

-63.01

-1937.96

-8.00

* Note: The latest data for services sector released by RBI is for November 2021. The data for December 2021 is an estimation, which will be revised based on RBI’s subsequent release. (ii) Data for 2019, 2020 and April to September 2021 are revised on pro-rata basis using quarterly balance of payments data.

Fig 2: Overall Trade during April-December 2021*
MERCHANDISE TRADE

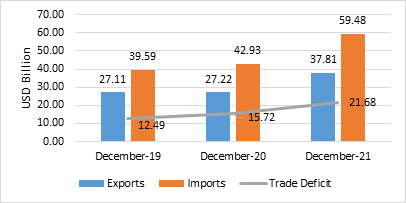
  • Merchandise exports in December 2021 were USD 37.81 Billion, as compared to USD 27.22 Billion in December 2020, exhibiting a positive growth of 38.91 per cent. As compared to December 2019, exports in December 2021 exhibited a positive growth of 39.47 per cent.
  • Merchandise imports in December 2021 were USD 59.48 Billion, which is an increase of 38.55 per cent over imports of USD 42.93 Billion in December 2020. Imports in December 2021 have registered a positive growth of 50.24 per cent in comparison to December 2019.
  • The merchandise trade balance for December 2021 was estimated at USD (-)  21.68 Billion as against USD (-) 15.72 Billion in December 2020, which is a decline of (-) 37.92 per cent. As compared to December 2019 (USD (-) 12.49 Billion), trade balance in December 2021 exhibited a negative growth of (-) 73.61 per cent.


Fig 3: Merchandise Trade during December 2021
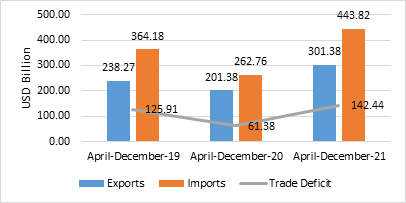
  • Merchandise exports for the period April-December 2021 was USD 301.38 Billion as against USD 201.38 Billion during the period April-December 2020, registering a positive growth of 49.66 per cent. As compared to April-December 2019, exports in April-December 2021 exhibited a positive growth of 26.49 per cent.
  • Merchandise imports for the period April-December 2021 was USD 443.82 Billion as against USD 262.76 Billion during the period April-December 2020, registering a positive growth of 68.91 per cent. Imports in April-December 2021 have registered a positive growth of 21.87 per cent in comparison to April-December 2019.
  • The merchandise trade balance for April-December 2021 was estimated at USD (-) 142.44 Billion as against USD (-) 61.38 Billion in April-December 2020, which is a decline of (-) 132.07 per cent. As compared to April-December 2019 (USD (-) 125.91 Billion), trade balance in April-December 2021 exhibited a negative growth of (-) 13.13 per cent.

Fig 4: Merchandise Trade during April- December 2021
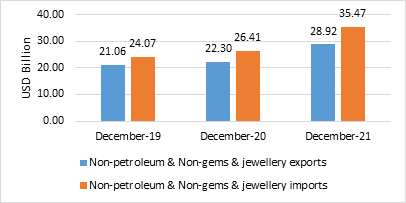
  • Non-petroleum and non-gems & jewellery exports in December 2021 were USD 28.92 Billion, registering a positive growth of 29.67 per cent over non-petroleum and non-gems & jewellery exports of USD 22.30 Billion in December 2020 and a positive growth of 37.31 per cent over non-petroleum and non-gems & jewellery exports of USD 21.06 Billion in December 2019. 
  • Non-petroleum, non-gems & jewellery (gold, silver & precious metals) imports were USD 35.47 Billion in December 2021 with a positive growth of 34.28 per cent over Non-petroleum, non-gems & jewellery imports of USD 26.41 Billion in December 2020 and a positive growth of 47.32 per cent over Non-petroleum, non-gems & jewellery imports of USD 24.07 Billion in December 2019.

Table 3: Trade excluding Petroleum and Gems & Jewellery during December 2021


December 2021

(USD Billion)

December 2020

(USD Billion)

December 2019

(USD Billion)

Growth vis-à-vis December 2020 (%)

Growth vis-à-vis December 2019 (%)

Non- petroleum exports

31.92

24.88

23.48

28.29

35.97

Non- petroleum imports

43.32

33.31

28.88

30.07

50.02

Non-petroleum & Non Gems & Jewellery exports

28.92

22.30

21.06

29.67

37.31

Non-petroleum & Non Gems & Jewellery imports*

35.47

26.41

24.07

34.28

47.32

Note: Gems & Jewellery Imports include Gold, Silver & Pearls, precious & Semi-precious stones

Fig 5: Trade excluding Petroleum and Gems & Jewellery during December 2021
 

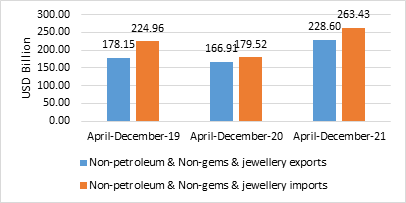
  • Non-petroleum and non-gems & jewellery exports during April-December 2021 was USD 228.60 Billion, an increase of 36.96 per cent over non-petroleum and non-gems & jewellery exports of USD 166.91 Billion in April-December 2020 and an increase of 28.32 per cent over non-petroleum and non-gems & jewellery exports of USD 178.15 Billion in April-December 2019.
  • Non-petroleum, non-gems & jewellery (gold, silver & precious metals) imports were USD 263.43 Billion in April-December 2021, recording a positive growth of 46.74 per cent, as compared to Non-petroleum, non-gems & jewellery imports of USD 179.52 Billion in April-December 2020 and a positive growth of 17.10 per cent over USD 224.96 Billion in April-December 2019.

Table 4: Trade excluding Petroleum and Gems & Jewellery during April-December 2021


April-December 2021

(USD Billion)

April-December 2020

(USD Billion)

April-December 2019

(USD Billion)

Growth vis-à-vis April-December 2020 (%)

Growth vis-à-vis April-December 2019 (%)

Non- petroleum exports

257.50

183.79

206.13

40.11

24.92

Non- petroleum imports

325.56

208.80

267.47

55.92

21.72

Non-petroleum & Non Gems & Jewellery exports

228.60

166.91

178.15

36.96

28.32

Non-petroleum & Non Gems & Jewellery imports*

263.43

179.52

224.96

46.74

17.10

Note: Gems & Jewellery Imports include Gold, Silver & Pearls, precious & Semi-precious stones

Fig 6: Trade excluding Petroleum and Gems & Jewellery during April-December 2021
SERVICES TRADE

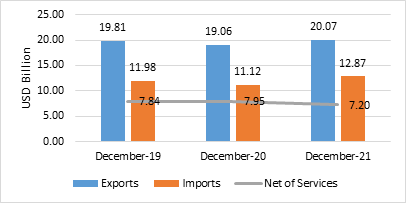
  • The estimated value of services export for December 2021* is USD 20.07 Billion, exhibiting a positive growth of 5.26 per cent vis-a-vis December 2020 (USD 19.06 Billion) and a positive growth of 1.29 per cent vis-à-vis December 2019 (USD 19.81 Billion).
  • The estimated value of services import for December 2021* is USD 12.87 Billion exhibiting a positive growth of 15.76 per cent vis-à-vis December 2020 (USD 11.12 Billion) and a positive growth of 7.44 per cent vis-à-vis December 2019 (USD 11.98 Billion).
  • The services trade balance in December 2021* is estimated at USD 7.20 Billion, which is a decline of (-) 9.42 per cent over December 2020 (USD 7.95 Billion) and a decline of (-) 8.12 per cent over December 2019 (USD 7.84 Billion).

Fig 7: Services Trade during December 2021*
  • The estimated value of services export for April-December 2021* is USD 177.68 Billion, exhibiting a positive growth of 18.39 per cent vis-a-vis April-December 2020 (USD 150.09 Billion) and a positive growth of 10.96 per cent vis-à-vis April-December 2019 (USD 160.13 Billion).
  • The estimated value of services imports for April-December 2021* is USD 103.30 Billion exhibiting a positive growth of 21.52 per cent vis-à-vis April-December 2020 (USD 85.00 Billion) and a positive growth of 6.23 per cent vis-à-vis April-December 2019 (USD 97.24 Billion).
  • The services trade balance for April-December 2021* was estimated at USD 74.39 Billion as against USD 65.08 Billion in April-December 2020, which is an increase of 14.30 per cent. As compared to April-December 2019 (USD 62.90 Billion), net of services in April-December 2021* exhibited a positive growth of 18.27 per cent. 

Fig 8: Services Trade during April-December 2021*
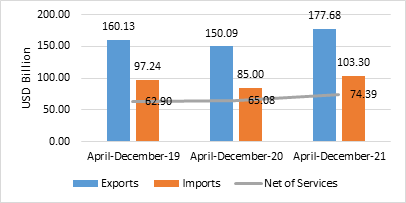
 

Table 5: Export Growth in Commodity Groups in December 2021

Sl. No.

Commodities

(Values in Million USD)

% Change

DEC'20

DEC'21

DEC'21


Commodity groups exhibiting positive growth

1

Petroleum Products

2336.63

5887.67

151.97

2

Coffee

44.00

98.47

123.80

3

Mica, Coal & Other Ores, Minerals including processed minerals

337.08

539.23

59.97

4

Plastic & Linoleum

570.49

899.85

57.73

5

Cotton Yarn/Fabs./made-ups, Handloom Products etc.

987.76

1443.98

46.19

6

Other cereals

96.24

140.17

45.65

7

Engineering Goods

7072.63

9788.88

38.41

8

Man-made Yarn/Fabs./made-ups etc.

380.52

518.22

36.19

9

Electronic Goods

1248.33

1672.59

33.99

10

Rice

682.77

895.08

31.10

11

Marine Products

562.85

720.51

28.01

12

Organic & Inorganic Chemicals

2100.00

2664.15

26.86

13

RMG of all Textiles

1195.78

1466.43

22.63

14

Fruits & Vegetables

190.07

227.53

19.71

15

Leather & leather products

338.49

404.41

19.48

16

Meat, dairy & poultry products

335.53

396.89

18.29

17

Gems & Jewellery

2575.67

2997.44

16.38

18

Oil seeds

147.72

165.29

11.90

19

Jute Mfg. including Floor Covering

41.78

46.73

11.86

20

Handicrafts excl. handmade carpet

180.34

196.13

8.75

21

Cereal preparations & miscellaneous processed items

183.48

199.18

8.56

22

Carpet

156.08

166.14

6.45

23

Drugs & Pharmaceuticals

2203.53

2318.04

5.20

Sl. No.

Commodities

(Values in Million USD)

% Change

DEC'20

DEC'21

DEC'21


Commodity Groups exhibiting negative growth

24

Iron Ore

382.38

54.44

-85.76

25

Oil Meals

236.75

119.67

-49.45

26

Cashew

52.29

39.09

-25.24

27

Spices

344.92

314.40

-8.85

28

Tea

74.43

68.61

-7.82

29

Ceramic products & glassware

310.62

294.23

-5.28

30

Tobacco

82.88

82.13

-0.90

 Table 6: Import Growth in Commodity Groups in December 2021

Sl. No.

Commodities

(Values in Million USD)

% Change

DEC'20

DEC'21

DEC'21


Commodity Groups exhibiting positive growth

1

Silver

10.39

232.04

2133.30

2

Sulphur & Unroasted Iron Pyrites

19.69

69.95

255.26

3

Fertilisers, Crude & manufactured

632.38

1712.03

170.73

4

Newsprint

12.07

27.18

125.19

5

Pulp and Waste paper

75.53

164.25

117.46

6

Metaliferrous ores & other minerals

429.52

857.30

99.59

7

Organic & Inorganic Chemicals

1879.88

3253.17

73.05

8

Coal, Coke & Briquettes, etc.

1624.32

2803.09

72.57

9

Cotton Raw & Waste

30.58

52.73

72.43

10

Project goods

127.03

215.58

69.71

11

Petroleum, Crude & products

9629.01

16165.97

67.89

12

Leather & leather products

50.02

76.08

52.10

13

Vegetable Oil

1210.88

1827.33

50.91

14

Dyeing/tanning/colouring materials

281.04

402.57

43.24

15

Artificial resins, plastic materials, etc.

1434.57

1970.30

37.34

16

Iron & Steel

1265.30

1722.90

36.17

17

Non-ferrous metals

1303.56

1705.32

30.82

18

Electronic goods

5037.69

6427.30

27.58

19

Fruits & vegetables

240.36

305.64

27.16

20

Textile yarn Fabric, made-up articles

180.93

229.20

26.68

21

Pearls, precious & Semi-precious stones

2397.17

2891.13

20.61

22

Machinery, electrical & non-electrical

3149.33

3796.75

20.56

23

Medicinal & Pharmaceutical products

623.44

743.89

19.32

24

Wood &  Wood products

470.32

548.23

16.57

25

Professional instrument, Optical goods, etc.

467.38

511.74

9.49

26

Chemical material & products

876.78

942.36

7.48

27

Gold

4485.76

4729.47

5.43

28

Machine tools

347.52

363.26

4.53

Sl. No.

Commodities

(Values in Million USD)

% Change

DEC'20

DEC'21

DEC'21


Commodity Groups exhibiting negative growth

29

Pulses

294.61

189.65

-35.63

30

Transport equipment

2476.59

2306.43

-6.87

  Table 7: MERCHANDISE TRADE 

EXPORTS & IMPORTS: (Rs. Crore)

(PROVISIONAL)


DECEMBER

APRIL-DECEMBER

EXPORTS(including re-exports)


2019-20

1,92,984.47

16,77,370.97

2020-21

2,00,294.50

15,00,019.98

2021-22

2,84,960.74

22,38,821.02

%Growth 2021-22/ 2020-21

42.27

49.25

%Growth 2021-22/ 2019-20

47.66

33.47

IMPORTS


2019-20

2,81,880.86

25,62,539.91

2020-21

3,15,970.77

19,56,256.92

2021-22

4,48,352.86

32,98,494.98

%Growth 2021-22/ 2020-21

41.90

68.61

%Growth 2021-22/ 2019-20

59.06

28.72

TRADE BALANCE


2019-20

-88,896.39

-8,85,168.94

2020-21

-1,15,676.27

-4,56,236.94

2021-22

-1,63,392.12

-10,59,673.96

Table 8: SERVICES TRADE 

EXPORTS & IMPORTS (SERVICES) : (US $ Billion)


(PROVISIONAL)

November 2021

April-

November 2021

EXPORTS (Receipts)

20.14

157.62

IMPORTS (Payments)

12.59

90.43

TRADE BALANCE

7.55

67.19


EXPORTS & IMPORTS (SERVICES): (Rs. Crore)


(PROVISIONAL)

November 2021

April-

November 2021

EXPORTS (Receipts)

1,50,006.15

11,68,297.72

IMPORTS (Payments)

93,753.85

6,70,401.42


TRADE BALANCE

56,252.31

4,97,896.29

Source: RBI Press Release dated 4th January 2022


 * Link for quick estimates

***

Topics

Acts Income Tax
