

Loading...

Top
Help
×

By creating an account you can:

Logo TaxTMI
Call Us / Help / Feedback

Contact Us At :

E-mail: [email protected]

Call / WhatsApp at: +91 99117 96707

For more information, Check Contact Us

FAQs :

To know Frequently Asked Questions, Check FAQs

Most Asked Video Tutorials :

For more tutorials, Check Video Tutorials

Submit Feedback/Suggestion :

Email :
Please provide your email address so we can follow up on your feedback.
Category :
Description :
Min 15 characters 0/2000
Make Most of Text Search
  1. Checkout this video tutorial: How to search effectively on TaxTMI.
  2. Put words in double quotes for exact word search, eg: "income tax"
  3. Avoid noise words such as : 'and, of, the, a'
  4. Sort by Relevance to get the most relevant document.
  5. Press Enter to add multiple terms/multiple phrases, and then click on Search to Search.
  6. Text Search
  7. The system will try to fetch results that contains ALL your words.
  8. Once you add keywords, you'll see a new 'Search In' filter that makes your results even more precise.
  9. Text Search
Add to...
You have not created any category. Kindly create one to bookmark this item!
Create New Category
Hide
Title :
Description :
❮❮ Hide
Default View
Expand ❯❯
Close ✕
🔎 News - Adv. Search
TEXT SEARCH:

Press 'Enter' to add multiple search terms. Rules for Better Search

Search In:
Main Text + AI Text
  • Main Text
  • Main Text + AI Text
  • AI Text
Category: ?
Categorized by AI
---- All Categories ----
  • ---- All Categories ----
  • Income Tax
  • GST
  • Customs, DGFT & SEZ
  • FEMA & RBI
  • Corp. Laws, SEBI & IBC
  • PMLA, Black Money & ED
  • Budget
  • News and Press Release
  • PTI News
Month:
---- All Months ----
  • ---- All Months ----
  • January
  • February
  • March
  • April
  • May
  • June
  • July
  • August
  • September
  • October
  • November
  • December
Year:
---- All Years ----
  • ---- All Years ----
  • 2026
  • 2025
  • 2024
  • 2023
  • 2022
  • 2021
  • 2020
  • 2019
  • 2018
  • 2017
  • 2016
  • 2015
  • 2014
  • 2013
  • 2012
  • 2011
Sort By: ?
In Sort By 'Default', exact matches for text search are shown at the top, followed by the remaining results in their regular order.
Relevance Default Date
    Haryana govt, RBI review measures to tackle financial frauds
    Union law minister Meghwal inaugurates ITAT's new premises in Kolkata
    Enabling Filing of Appeals in Cases Involving NIL or Zero Demand Amount
    DGFT Introduces Open API Facility for Certificate of Origin on the Trade Connect e-Platform
    Amid global turmoil, India maintained momentum of its economic growth, says Amit Shah
    Zaggle Brings Cricket and Business Together in Hyderabad; Hosts Padma Bhushan Dr. Sunil Gavaskar
    AI may accelerate anti-competitive practices in digital markets: CCI chief
    Union Minister of Commerce and Industry Shri Piyush Goyal Calls for India to Emerge as a Global Medical and Healthcare Destination
    Union Minister of Commerce and Industry Shri Piyush Goyal Calls for Trained Caregivers and Wider Hospital Participation in Heal in India Gateway
    Rupee falls 7 paise to close at 94.50 against US dollar
    India Must Build Resilient, Globally Integrated Healthcare Supply Chains: Commerce and Industry Minister Shri Piyush Goyal at Bharat Health Global Exp...
    Rupee rises 4 paise to 94.39 against US dollar in early trade
    Jantar Mantar student stir, mass struggles could impact Assembly polls: MA Baby
    FDA awaiting response from restaurants at Mumbai Cricket Association premises: Mundhe
    India emerges as key diesel supplier to Europe as Russian, US flows falter
    Trump keeps heralding an economic boom, but even a solid jobs report is causing problems for him
    Telangana CM urges TCS'' HyperVault to launch its Hyderabad AI data centre by June 2028
    CBI FIR against Subhash Chandra for 'inflating' net worth to secure Rs 980 Cr in loans
    TCS subsidiary HyperVault to invest Rs 70,000 cr to develop Hyderabad AI data centre
    CBI FIR against Subhash Chandra for 'inflation' of net worth to secure nearly Rs 1,000-cr in loans
❯❯
Maximize Maximize Maximize
0 / 200
Expand Note
Add to Folder

No Folders have been created

+

Are you sure you want to delete "My most important" ?

NOTE:

News
Showing Results for :
Reset Filters
Results Found:
Show All Summaries Hide All Summaries
September 7, 2026
Show AI Summary
Appeals against NIL or Zero GST demand orders are enabled where taxpayers paid liabilities before issuance of the order.
GST Portal validation restricting appeals against demand orders showing NIL or Zero demand has been removed where a liability dispute exists and the taxpayer made payment before issuance of the demand order. Taxpayers may challenge such orders by filing an appeal in Form GST APL-01, and may raise a ticket with the GST Helpdesk if filing difficulties arise.
September 7, 2026
Show AI Summary
Certificate of origin API integration enables exporters to submit applications, receive certificates, verify issuance, and reduce repetitive data entry.
Open API integration for Certificates of Origin enables eligible exporters to connect ERP, accounting and other business software with the Trade Connect e-Platform for electronic application submission. The facility covers preferential and non-preferential certificates, provides authentication, file-submission and certificate-verification APIs, and maintains a transaction ledger for application tracking. Security measures include digital signatures, password hashing, IP whitelisting and time-limited access tokens. Relevant origin criteria, fields and validation rules are automatically applied according to the selected trade agreement or certification scheme.
September 7, 2026
Show AI Summary
Free trade agreements and strategic partnerships were identified as supporting India's trade engagement and economic growth amid geopolitical disruption.
India's international economic engagement through free trade agreements and strategic partnerships was identified as a means of sustaining economic growth amid geopolitical disruption. Economic cooperation was described as extending across defence, technology, energy, investment and trade. Nine free trade agreements were stated to have been concluded by 2026, with further trade arrangements proposed with other countries. Pursuit of free trade agreements was linked to increasing trade and to reported first-quarter GDP growth in the financial year 2026-27.
September 7, 2026
Show AI Summary
Leadership, talent recognition and legacy framed a discussion linking cricketing performance with entrepreneurship and organisational responsibility.
No FEMA or RBI regulatory measure, compliance obligation, legal interpretation, or adjudicatory determination is identified. The subject matter concerns leadership, performance and entrepreneurship, with emphasis on preparation, decision-making under pressure, teamwork, recognising potential and supporting talent. Corporate success is linked with creating opportunities, contributing to society and building a lasting legacy. Zaggle is described as providing enterprise spend management, card-based financial products through banking partnerships and software offerings for corporate customers.
September 7, 2026
Show AI Summary
AI-driven digital markets require competition scrutiny of autonomous pricing, self-preferencing, discriminatory pricing, tying, and market manipulation.
Artificial intelligence may accelerate anti-competitive conduct in digital markets through self-preferencing, discriminatory pricing, tying and market manipulation. Agentic AI may create particular concerns where it monitors competitors' prices and autonomously responds without direct human intervention. Competition law aims to prevent anti-competitive practices, promote competition, protect consumers and preserve freedom of trade, while allowing legitimate growth and innovation. Market dominance is not objectionable in itself; concern arises from abuse of dominance through exclusionary or exploitative practices.
September 7, 2026
Show AI Summary
Healthcare innovation and supply-chain self-reliance are prioritised through trade access, investment, research collaboration, testing infrastructure, and quality standards.
Healthcare-sector development priorities seek to expand medical devices, diagnostics, digital health, research, and pharmaceutical machinery through exports, import substitution, and services growth. Free trade agreements are presented as supporting preferential market access, services opportunities, and mobility. Sectoral growth is linked to startup incubation, intellectual-property capability, international research collaboration, technology transfer, and joint ventures. Healthcare self-reliance requires indigenous equipment, critical components, resilient supply chains, shared testing and certification infrastructure, and uncompromising quality standards.
September 7, 2026
Show AI Summary
Medical value tourism quality standards prioritise verified hospitals, ethical treatment, transparent pricing, and seamless international patient care.
Medical value tourism is proposed to expand through trained caregivers, transparent treatment packages, ethical hospital practices, seamless reimbursement and cashless-payment systems, telemedicine, and verified hospital participation. International patients are intended to receive care through accredited quality systems, supported by interpreters, global outreach, and coordinated healthcare networks. Expansion beyond metropolitan areas must maintain equivalent high-quality care for domestic and foreign patients without discrimination. Certification systems are expected to remain professionally independent and free from unethical influence.
September 7, 2026
Show AI Summary
Foreign exchange market pressures from rising crude oil and weak domestic equities constrained rupee support from foreign inflows.
Foreign exchange market conditions caused the rupee to depreciate against the US dollar despite support from FCNR dollar inflows and a softer dollar. Rising crude oil prices, weak domestic equities and global headwinds constrained gains. The outlook remained dependent on foreign inflows, dollar movements, crude prices, market sentiment and inflation data, with geopolitical tensions capable of increasing pressure on the currency.
September 7, 2026
Show AI Summary
Healthcare supply-chain resilience requires diversified sourcing, global investment, domestic innovation, and stronger medical-device production supported by enabling infrastructure.
Healthcare supply-chain resilience requires diversified sourcing, restoration of domestic capacity in Active Pharmaceutical Ingredients and Key Starting Materials, and continued imports where necessary through multiple suppliers and geographies. Pharmaceutical industry growth should move beyond generics towards research, development, patented products, new molecules, biosimilars and biotechnology. Regulatory convergence should support clinical trials, patenting and new-product introduction. Government support is contemplated for medical value travel, healthcare infrastructure, bulk drug parks, plug-and-play facilities, medical-device component production and scientific validation of Ayush products.
September 7, 2026
Show AI Summary
Foreign exchange market pressures offset rupee support from FCNR inflows amid higher crude oil and dollar demand.
The rupee gained marginally against the US dollar, supported by FCNR-related dollar inflows and robust liquidity. Elevated Brent crude prices, safe-haven dollar demand and geopolitical tensions constrained this support. Higher oil prices may enlarge India's import bill, increase dollar demand and pressure the rupee, although rising foreign-exchange reserves indicated external-sector strength.
September 6, 2026
Show AI Summary
Census data privacy and electoral integrity concerns emerge alongside calls to repeal insolvency law and protect political dissent.
CPI(M) called for repeal of the Insolvency and Bankruptcy Code, alleging that insolvency processes enabled diversion of public resources. It questioned economic growth figures against agricultural weakness, mining contraction, higher input costs, inflation, unemployment and malnutrition. The party also raised Census data privacy concerns over caste-data collection, potential linkage with government databases, and possible implications for citizenship, electoral rolls and future delimitation.
September 6, 2026
Show AI Summary
Food business licensing: Third-party restaurant operators require their own licences and cannot operate under another entity's registration.
Food Business Operator licensing requires the entity holding a food licence or registration to itself conduct the licensed food business at the specified premises. A third-party operator cannot operate under another entity's licence or registration and must obtain its own licence or registration. Regulatory notices concerning such arrangements may also address hygiene lapses and structural violations, followed by consideration of the operators' responses.
September 6, 2026
Show AI Summary
European diesel supply dependence on alternative refiners grows amid constrained exports, weakening transatlantic flows, and restricted shipping routes.
European diesel supply is becoming increasingly dependent on Indian refining capacity as Russian diesel and gasoil exports remain constrained by export restrictions, refinery disruptions and port outages, while US shipments to Europe have weakened. Alternative supply routes offer limited additional clean-product volumes because reduced tanker crossings and lower ship-to-ship transfers offshore Oman constrain flows through the Strait of Hormuz. Low diesel inventories, seasonal demand and planned refinery maintenance increase exposure to supply disruptions.
September 5, 2026
Show AI Summary
Tariff-driven inflation and elevated borrowing costs constrain growth, while durable deficit reduction may require spending restraint and tax increases.
Persistent inflation, elevated interest rates and rising public debt constrain economic growth policy. Tariffs and oil shortages are identified as contributing to inflationary pressures, while lower interest rates could increase money flows and worsen inflation. Tariffs, tax cuts, artificial intelligence productivity gains and anti-fraud measures are advanced as mechanisms to support growth, investment and domestic employment. Fiscal sustainability, however, cannot be achieved through growth alone where social security and healthcare costs exceed revenue growth; deficit reduction may require slower spending, spending reductions and tax increases.
September 5, 2026
Show AI Summary
AI data centre development receives state support for a high-capacity campus and accelerated commissioning timetable.
HyperVault's proposed artificial-intelligence data-centre campus in Hyderabad is planned on 264 acres, with investment projected at up to Rs 70,000 crore and capacity of up to 1 GW. The campus is intended to provide high-density, liquid-cooled computing infrastructure for frontier AI companies and hyperscalers. Telangana's Chief Minister sought inauguration by June 2, 2028, while assuring required governmental sanctions and support. The project is estimated to create 7,000 jobs.
September 5, 2026
Show AI Summary
Inflated net-worth certificates allegedly enabled secured lending, triggering fraud, breach-of-trust and asset-stripping allegations after default.
Alleged inflation of net-worth certificates is said to have induced approval and disbursal of two corporate loan facilities aggregating Rs 980 crore, each secured by continuing personal guarantees. The facilities subsequently defaulted. The FIR alleges that materially higher net-worth representations made in 2018 were later contradicted during insolvency proceedings, and attributes the lending to collusion among the guarantor, borrower entities and their officers. Allegations include cheating, creation of false documents, misappropriation and misapplication of loan funds, breach of trust, and asset stripping intended to frustrate recovery.
September 5, 2026
Show AI Summary
AI data centre infrastructure investment enables phased deployment of high-density, liquid-cooled computing capacity using green and water-neutral design.
HyperVault plans to develop an artificial intelligence data-centre campus on 264 acres in Hyderabad, with capacity of up to 1 GW and investment by HyperVault and its partners of up to Rs 70,000 crore. The facility is intended to provide high-density, liquid-cooled computing infrastructure for frontier AI companies and hyperscalers. Development will proceed in phases according to customer demand and technology requirements, incorporating green-energy use and water-neutral design principles.
September 5, 2026
Show AI Summary
Alleged inflation of personal net worth underpins fraud and breach-of-trust accusations over secured corporate lending.
CBI registration of an FIR concerns allegations that inflated personal net-worth certificates were used to secure corporate loan facilities from Life Insurance Corporation Housing Finance Ltd. The lender alleges that the certificates influenced lending decisions, the facilities subsequently defaulted, and later insolvency proceedings disclosed inconsistency between the represented and asserted net-worth figures. Allegations include collusion with borrower entities, false documentation, cheating, misappropriation of loan funds, and breach of lender trust.

News

Back

All News

Showing Results for :
Reset Filters
No Records Found

News

Showing Results for : Reset Filters
Customs, DGFT & SEZ

INDIA’S FOREIGN TRADE: November 2021

December 14, 2021

Contents
Summary
Note

Note

-

Bookmark

Print

Print

INDIA’S FOREIGN TRADE: November 2021

Overall exports rise by 22.8%, imports up by 48.54% over last November

Overall exports in first 8 months of current FY (April-November 2021) jumped by 37.21%, imports shot up by 61.02% over the same period last year

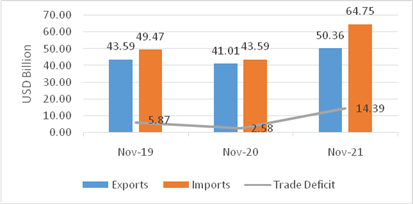
  • India’s overall exports (Merchandise and Services combined) in November 2021* are estimated to be USD 50.36 Billion, exhibiting a positive growth of 22.80 per cent over the same period last year and a positive growth of 15.53 per cent over November 2019. Overall imports in November 2021* are estimated to be USD 64.75 Billion, exhibiting a positive growth of 48.54 per cent over the same period last year and a positive growth of 30.90 per cent over November 2019

Table 1: Trade during November 2021*


November 2021

(USD Billion)

November 2020

(USD Billion)

November 2019

(USD Billion)

Growth vis-à-vis November 2020 (%)

Growth vis-à-vis November 2019 (%)

Merchandise

Exports

30.04

23.62

25.77

27.16

16.55

Imports

52.94

33.81

38.52

56.58

37.44

Trade Balance

-22.91

-10.19

-12.75

-124.77

-79.65

Services*

Exports

20.33

17.39

17.82

16.88

14.06

Imports

11.81

9.78

10.94

20.71

7.90

Net of Services

8.52

7.61

6.88

11.95

23.84

Overall Trade (Merchandise+

Services)*

Exports

50.36

41.01

43.59

22.80

15.53

Imports

64.75

43.59

49.47

48.54

30.90

Trade Balance

-14.39

-2.58

-5.87

-457.27

-145.04

* Note: The latest data for services sector released by RBI is for October 2021. The data for November 2021 is an estimation, which will be revised based on RBI’s subsequent release. (ii) Data for 2019, 2020 and April to June 2021 are revised on pro-rata basis using quarterly balance of payments data.

Fig 1: Overall Trade during November 2021*
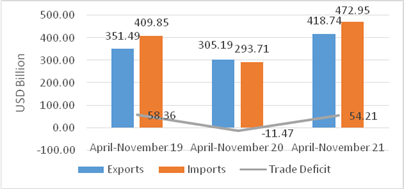
  • India’s overall exports (Merchandise and Services combined) in April-November 2021* are estimated to be USD 418.74 Billion, exhibiting a positive growth of 37.21 per cent over the same period last year and a positive growth of 19.13 per cent over April-November 2019. Overall imports in April-November 2021* are estimated to be USD 472.95 Billion, exhibiting a positive growth of 61.02 per cent over the same period last year and a positive growth of 15.39 per cent over April-November 2019.

Table 2: Trade during April-November 2021*


April-November 2021

(USD Billion)

April-November 2020

(USD Billion)

April-November 2019

(USD Billion)

Growth vis-à-vis April-November 2020 (%)

Growth vis-à-vis April-November 2019 (%)

Merchandise

Exports

263.57

174.16

211.17

51.34

24.82

Imports

384.34

219.82

324.59

74.84

18.41

Trade Balance

-120.76

-45.66

-113.42

-164.49

-6.47

Services*

Exports

155.17

131.02

140.32

18.43

10.58

Imports

88.61

73.89

85.26

19.92

3.92

Net of Services

66.56

57.13

55.06

16.50

20.88

Overall Trade (Merchandise+

Services)*

Exports

418.74

305.19

351.49

37.21

19.13

Imports

472.95

293.71

409.85

61.02

15.39

Trade Balance

-54.21

11.47

-58.36

-572.43

7.12

* Note: The latest data for services sector released by RBI is for October 2021. The data for November 2021 is an estimation, which will be revised based on RBI’s subsequent release. (ii) Data for 2019, 2020 and April to June 2021 are revised on pro-rata basis using quarterly balance of payments data.

Fig 2: Overall Trade during April-November 2021*
MERCHANDISE TRADE

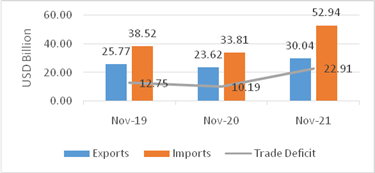
  • Merchandise exports in November 2021 were USD 30.04 Billion, as compared to USD 23.62 Billion in November 2020, exhibiting a positive growth of 27.16 per cent. As compared to November 2019, exports in November 2021 exhibited a positive growth of 16.55 per cent.
  • Merchandise imports in November 2021 were USD 52.94 Billion, which is an increase of 56.58 per cent over imports of USD 33.81 Billion in November 2020. Imports in November 2021 have registered a positive growth of 37.44 per cent in comparison to November 2019.
  • The merchandise trade balance for November 2021 was estimated at USD (-) 22.91 Billion as against USD (-) 10.19 Billion in November 2020, which is a decline of (-) 124.77 per cent. As compared to November 2019 (USD (-) 12.75 Billion), trade balance in November 2021 exhibited a negative growth of (-) 79.65 per cent.

Fig 3: Merchandise Trade during November 2021
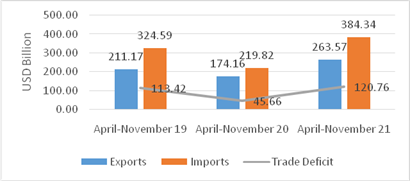
  • Merchandise exports for the period April-November 2021 was USD 263.57 Billion as against USD 174.16 Billion during the period April-November 2020, registering a positive growth of 51.34 per cent. As compared to April-November 2019, exports in April-November 2021 exhibited a positive growth of 24.82 per cent.
  • Merchandise imports for the period April-November 2021 was USD 384.34 Billion as against USD 219.82 Billion during the period April-November 2020, registering a positive growth of 74.84 per cent. Imports in April-November 2021 have registered a positive growth of 18.41 per cent in comparison to April-November 2019.
  • The merchandise trade balance for April-November 2021 was estimated at USD (-) 120.76 Billion as against USD (-) 45.66 Billion in April-November 2020, which is a decline of (-) 164.49 per cent. As compared to April-November 2019 (USD (-) 113.42 Billion), trade balance in April-November 2021 exhibited a negative growth of (-) 6.47 per cent.

Fig 4: Merchandise Trade during April- November 2021
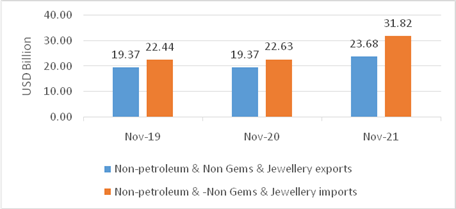
  • Non-petroleum and non-gems & jewellery exports in November 2021 were USD 23.68 Billion, registering a positive growth of 22.26 per cent over non-petroleum and non-gems & jewellery exports of USD 19.37 Billion in November 2020 and a positive growth of 22.28 per cent over non-petroleum and non-gems & jewellery exports of USD 19.37 Billion in November 2019.
  • Non-petroleum, non-gems & jewellery (gold, silver & precious metals) imports were USD 31.82 Billion in November 2021 with a positive growth of 40.64 per cent over Non-petroleum, non-gems & jewellery imports of USD 22.63 Billion in November 2020 and a positive growth of 41.82 per cent over Non-petroleum, non-gems & jewellery imports of USD 22.44 Billion in November 2019.

Table 3: Trade excluding Petroleum and Gems & Jewellery during November 2021


November 2021

(USD Billion)

November 2020

(USD Billion)

November 2019

(USD Billion)

Growth vis-à-vis November 2020 (%)

Growth vis-à-vis November 2019 (%)

Non- petroleum exports

26.08

22.06

21.95

18.19

18.78

Non- petroleum imports

38.27

27.50

27.45

39.17

39.38

Non-petroleum & Non Gems & Jewellery exports

23.68

19.37

19.37

22.26

22.28

Non-petroleum & Non Gems & Jewellery imports*

31.82

22.63

22.44

40.64

41.82

Note: Gems & Jewellery Imports include Gold, Silver & Pearls, precious & Semi-precious stones

Fig 5: Trade excluding Petroleum and Gems & Jewellery during November 2021
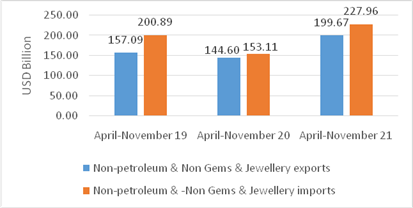
  • Non-petroleum and non-gems & jewellery exports during April-November 2021 was USD 199.67 Billion, an increase of 38.08 per cent over non-petroleum and non-gems & jewellery exports of USD 144.60 Billion in April-November 2020 and an increase of 27.11 per cent over non-petroleum and non-gems & jewellery exports of USD 157.09 Billion in April-November 2019.
  • Non-petroleum, non-gems & jewellery (gold, silver & precious metals) imports were USD 227.96 Billion in April-November 2021, recording a positive growth of 48.89 per cent, as compared to Non-petroleum, non-gems & jewellery imports of USD 153.11 Billion in April-November 2020 and a positive growth of 13.48 per cent over USD 200.89 Billion in April-November 2019.

Table 4: Trade excluding Petroleum and Gems & Jewellery during April-November 2021


April-November 2021

(USD Billion)

April-November 2020

(USD Billion)

April-November 2019

(USD Billion)

Growth vis-à-vis April-November 2020 (%)

Growth vis-à-vis April-November 2019 (%)

Non- petroleum exports

225.59

158.91

182.66

41.96

23.50

Non- petroleum imports

282.25

175.50

238.60

60.83

18.29

Non-petroleum & Non Gems & Jewellery exports

199.67

144.60

157.09

38.08

27.11

Non-petroleum & Non Gems & Jewellery imports*

227.96

153.11

200.89

48.89

13.48

Note: Gems & Jewellery Imports include Gold, Silver & Pearls, precious & Semi-precious stones

Fig 6: Trade excluding Petroleum and Gems &Jewellery during April-November 2021
SERVICES TRADE

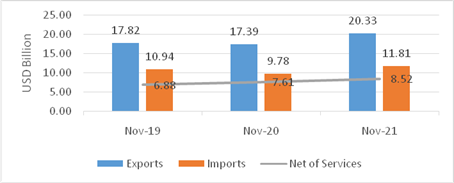
  • The estimated value of services export for November 2021* is USD 20.33 Billion, exhibiting a positive growth of 16.88 per cent vis-a-vis November 2020 (USD 17.39 Billion) and a positive growth of 14.06 per cent vis-à-vis November 2019 (USD 17.82 Billion).
  • The estimated value of services import for November 2021* is USD 11.81 Billion exhibiting a positive growth of 20.71 per cent vis-à-vis November 2020 (USD 9.78 Billion) and a positive growth of 7.90 per cent vis-à-vis November 2019 (USD 10.94 Billion).
  • The services trade balance in November 2021* is estimated at USD 8.52 Billion, which is an increase of 11.95 per cent over November 2020 (USD 7.61 Billion) and an increase of 23.84 per cent over November 2019 (USD 6.88 Billion).

Fig 7: Services Trade during November 2021*
  • The estimated value of services export for April-November 2021* is USD 155.17 Billion, exhibiting a positive growth of 18.43 per cent vis-a-vis April-November 2020 (USD 131.02 Billion) and a positive growth of 10.58 per cent vis-à-vis April-November 2019 (USD 140.32 Billion).
  • The estimated value of services imports for April-November 2021* is USD 88.61 Billion exhibiting a positive growth of 19.92 per cent vis-à-vis April-November 2020 (USD 73.89 Billion) and a positive growth of 3.92 per cent vis-à-vis April-November 2019 (USD 85.26 Billion).
  • The services trade balance for April-November 2021 was estimated at USD 66.56 Billion as against USD 57.13 Billion in April-November 2020, which is an increase of 16.50 per cent. As compared to April-November 2019 (USD 55.06 Billion), net of services in April-November 2021 exhibited a positive growth of 20.88 per cent.

Fig 8: Services Trade during April-November 2021*
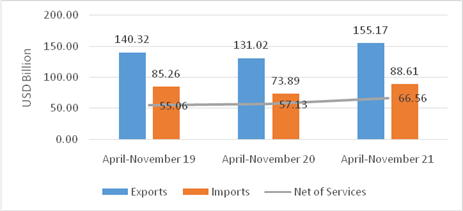
Table 5: Export Growth in Commodity Groups in November 2021

Sl. No.

Commodities

(Values in Million USD)

% Change

NOV'20

NOV'21

NOV'21


Commodity groups exhibiting positive growth

1

Petroleum Products

1557.36

3959.13

154.22

2

Coffee

45.08

75.34

67.12

3

Plastic & Linoleum

507.25

724.39

42.81

4

Cotton Yarn/Fabs./made-ups, Handloom Products etc.

872.55

1227.83

40.72

5

Engineering Goods

5896.67

8077.46

36.98

6

Other cereals

63.21

85.42

35.14

7

Organic & Inorganic Chemicals

1694.92

2246.50

32.54

8

Leather & leather products

273.30

356.56

30.47

9

Jute Mfg. including Floor Covering

32.76

42.63

30.11

10

Electronic Goods

1121.17

1455.58

29.83

11

Marine Products

586.64

754.00

28.53

12

Man-made Yarn/Fabs./made-ups etc.

340.54

428.36

25.79

13

Mica, Coal & Other Ores, Minerals including processed minerals

326.82

394.49

20.71

14

Rice

563.72

658.90

16.89

15

Fruits & Vegetables

161.80

186.58

15.31

16

Cereal preparations & miscellaneous processed items

154.88

163.84

5.79

17

RMG of all Textiles

1043.75

1072.17

2.72

18

Spices

313.86

317.72

1.23

19

Carpet

146.95

148.63

1.15

Sl. No.

Commodities

(Values in Million USD)

% Change

NOV'20

NOV'21

NOV'21


Commodity Groups exhibiting negative growth

20

Iron Ore

328.58

23.05

-92.98

21

Oil Meals

140.15

104.39

-25.51

22

Tobacco

76.69

62.72

-18.21

23

Tea

71.61

62.58

-12.62

24

Oil seeds

153.22

135.69

-11.44

25

Gems & Jewellery

2690.83

2392.20

-11.10

26

Handicrafts excl. hand made carpet

173.38

159.71

-7.89

27

Drugs & Pharmaceuticals

1963.40

1825.36

-7.03

28

Ceramic products & glassware

263.48

251.09

-4.70

29

Meat, dairy & poultry products

392.59

379.06

-3.45

30

Cashew

37.72

36.91

-2.15

Table 6: Import Growth in Commodity Groups in November 2021

Sl. No.

Commodities

(Values in Million USD)

% Change

NOV'20

NOV'21

NOV'21


Commodity Groups exhibiting positive growth

1

Silver

9.27

244.56

2538.19

2

Sulphur & Unroasted Iron Pyrts

9.32

47.87

413.63

3

Coal, Coke & Briquettes, etc.

1517.08

3577.42

135.81

4

Petroleum, Crude & products

6314.81

14677.80

132.43

5

Metaliferrous ores & other minerals

434.15

963.15

121.85

6

Pulp and Waste paper

67.22

148.30

120.62

7

Project goods

64.79

122.33

88.81

8

 Vegetable Oil

981.38

1754.92

78.82

9

Organic & Inorganic Chemicals

1515.51

2523.91

66.54

10

Newsprint

14.84

24.70

66.44

11

Artificial resins, plastic materials, etc.

1156.63

1859.00

60.73

12

Fertilisers, Crude & manufactured

898.16

1442.40

60.59

13

Dyeing/tanning/colouring mtrls.

233.84

359.98

53.94

14

Leather & leather products

45.11

68.22

51.23

15

Iron & Steel

986.14

1485.81

50.67

16

Gold

3022.59

4221.66

39.67

17

Cotton Raw & Waste

18.94

26.17

38.17

18

Medcnl. & Pharmaceutical products

534.89

735.70

37.54

19

Wood &  Wood products

361.92

487.63

34.73

20

Machine tools

248.17

333.30

34.30

21

Non-ferrous metals

1154.69

1521.16

31.74

22

Textile yarn Fabric, made-up articles

139.91

181.84

29.97

23

Machinery, electrical & non-electrical

2568.89

3274.31

27.46

24

Pulses

223.42

275.99

23.53

25

Electronic goods

4695.06

5714.68

21.72

26

Chemical material & products

785.06

912.58

16.24

27

Professional instrument, Optical goods, etc.

374.05

413.43

10.53

28

Pearls, precious & Semi-precious stones

1839.14

1978.67

7.59

Sl. No.

Commodities

(Values in Million USD)

% Change

NOV'20

NOV'21

NOV'21


Commodity Groups exhibiting negative growth

29

Transport equipment

1682.44

1357.83

-19.29

30

Fruits & vegetables

303.12

258.56

-14.70

Table 7: MERCHANDISE TRADE

EXPORTS & IMPORTS: (Rs. Crore)

(PROVISIONAL)


NOVEMBER

APRIL-NOVEMBER

EXPORTS(including re-exports)


2019-20

1,84,142.27

14,84,386.50

2020-21

1,75,306.78

12,99,725.47

2021-22

2,23,755.78

19,53,860.28

%Growth 2021-22/ 2020-21

27.64

50.33

%Growth 2021-22/ 2019-20

21.51

31.63

IMPORTS


2019-20

2,75,255.20

22,80,659.04

2020-21

2,50,954.16

16,40,286.15

2021-22

3,94,419.58

28,50,142.12

%Growth 2021-22/ 2020-21

57.17

73.76

%Growth 2021-22/ 2019-20

43.29

24.97

TRADE BALANCE


2019-20

-91,112.93

-7,96,272.55

2020-21

-75,647.38

-3,40,560.67

2021-22

-1,70,663.80

-8,96,281.84

Table 8: SERVICES TRADE

EXPORTS & IMPORTS (SERVICES) : (US $ Billion)


(PROVISIONAL)

October 2021

April-

October 2021

EXPORTS (Receipts)

19.85

134.84

IMPORTS (Payments)

11.61

76.80

TRADE BALANCE

8.24

58.04


EXPORTS & IMPORTS (SERVICES): (Rs. Crore)


(PROVISIONAL)

October 2021

April-

October 2021

EXPORTS (Receipts)

1,48,669.41

9,98,707.75

IMPORTS (Payments)

86,939.21

5,68,891.46

TRADE BALANCE

61,730.21

4,29,816.29

Source: RBI Press Release dated 1stDecember 2021


Topics

Acts Income Tax
