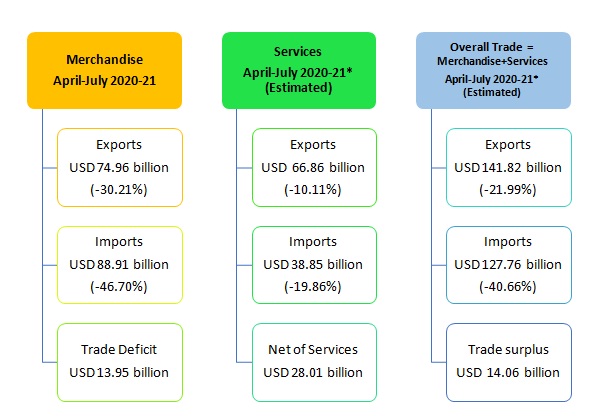
India’s overall exports (Merchandise and Services combined) in April-July2020-21* are estimated to be USD 141.82 billion, exhibiting a negative growth of (-)21.99per cent over the same period last year. Overall imports in April-July 2020-21* are estimated to be USD 127.76billion, exhibiting a negative growth of (-) 40.66per cent over the same period last year.
*Note: i) The latest data for services sector released by RBI is for June 2020. The data for July 2020 is an estimation, which will be revised based on RBI’s subsequent release ii) the figures in bracket are growth rates vis-à-vis corresponding period of last year.
I. MERCHANDISE TRADE
EXPORTS (including re-exports)
- Exports inJuly2020 were USD23.64 billion, as compared to USD26.33 billion in July 2019, exhibiting a negative growth of (-) 10.21 per cent. In Rupee terms, exports were ₹ 1,77,305.79 crore in July2020, as compared to ₹ 1,81,190.34 crore in July2019, registering a negative growth of (-) 2.14 per cent.
- Major commodities which have recorded positive growth during July 2020 vis-à-vis July 2019 are Other cereals (204.99%), Rice (47.99%), Iron ore (39.61%), Oil seeds (32.61%), Oil meals (28.44%), Meat, dairy & poultry products (22.14%), Fruits & vegetables (21.01%), Drugs & pharmaceuticals (19.53%), Coffee (14.27%), Cereal preparations & miscellaneous processed items (12.92%), Ceramic products & glassware (9.72%), Engineering goods (8.46%), Cotton yarn/fabs./made-ups, handloom products etc. (7.44%), Jute mfg. including floor covering (6.77%), Plastic & Linoleum (3.72%) and Carpet (1.96%).
- Major commodities which have recorded negative growth during July 2020 vis-à-vis July 2019 Petroleum products (-51.54%), Gems & jewellery (-49.61%), Leather & leather products (-26.96%), Man-made yarn/fabs./made-ups etc. (-23.33%), RMG of all textiles (-22.09%), Cashew (-21.25%), Marine products (-20.14%), Tobacco (-19.49%), Electronic goods (-17.42%), Spices (-11.38%), Mica, Coal & other ores, minerals including processed minerals (-8.21%), Handicrafts excl. hand made carpet (-6.12%), Tea (-3.97%) and Organic & Inorganic Chemicals (-0.05%).
- Cumulative value of exports for the period April-July 2020-21 was USD74.96 billion (₹ 5,66,322.06 crore) as against USD107.41 billion (₹ 7,45,174.85crore) during the period April-July 2019-20, registering a negative growth of (-) 30.21 per cent in Dollar terms (negative growth of (-) 24.00per cent in Rupee terms).
- Non-petroleum and Non-Gems and Jewellery exports in July 2020 were USD20.37 billion, as compared to USD19.70 billion in July2019, registering a positive growth of 3.40 per cent. Non-petroleum and Non-Gems and Jewellery exports in April-July 2020-21 were USD64.29billion, as compared to USD79.81 billion for the corresponding period in 2019-20, which is a decrease of (-) 19.45 per cent.
IMPORTS
- Imports in July2020 were USD28.47 billion (₹ 2,13,499.56 crore), which is a decline of (-) 28.40 per cent lower in Dollar terms and (-) 21.96 per cent in Rupee terms over imports of USD39.76 billion (₹ 2,73,579.71 crore) in July2019. Cumulative value of imports for the period April-July 2020-21 was USD88.91 billion (₹ 6,71,894.74 crore), as against USD166.80 billion (₹ 11,57,232.64 crore) during the period April-July 2019-20, registering a negativegrowth of (-) 46.70 per cent in Dollar terms and a negative growth of (-)41.94 per cent in Rupee terms.
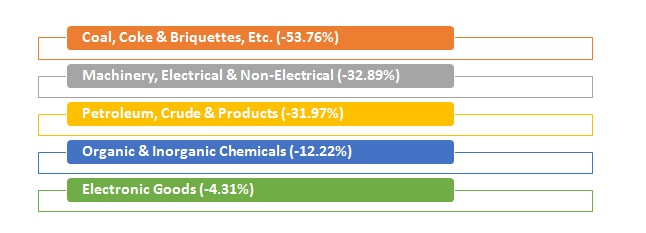
- Major commodity groups of import showing negative growth in July2020 over the corresponding month of last year are:
CRUDE OIL AND NON-OIL IMPORTS:
- Oil imports inJuly2020 were USD6.53billion (₹ 48,975.09 crore), which was 31.97 percentlower in Dollar terms (25.86 percent lower in Rupee terms), compared to USD9.60 billion (₹ 66,056.77 crore) in July2019. Oil imports inApril-July 2020-21 were USD19.61billion (₹ 148,234.51crore) which was 55.88per cent lower in Dollar terms (51.94percent lower in Rupee terms) compared to USD44.45billion (₹ 3,08,455.32crore), over the sameperiod last year.
- In this connection it is mentioned that the global Brent price ($/bbl) has decreased by 33.11% in July2020 vis-à-vis July2019 as per data available from World Bank.
- Non-oil imports inJuly2020 were estimated at USD21.94billion (₹ 1,64,524.47crore) which was 27.26per cent lower in Dollar terms (20.72percent lower in Rupee terms), compared to USD30.16billion (₹ 2,07,522.94crore) in July2019. Non-oil imports inApril-July 2020-21 were USD69.30billion (₹ 5,23,660.23crore) which was 43.36per cent lower in Dollar terms (38.30percent lower in Rupee terms), compared to USD122.35billion (₹ 8,48,777.32crore) in April-July2019-20.
- Non-Oil and Non-Gold imports wereUSD20.15billion in July2020, recording a negative growth of (-) 29.15per cent, as compared to Non-Oil and Non-Gold importsof USD 28.45billion in July2019. Non-Oil and Non-Gold imports wereUSD66.82billion in April-July 2020-21, recording a negative growth of (-) 38.80per cent, as compared to Non-Oil and Non-Gold importsUSD 109.19billion in April-July 2019-20.
II. TRADE IN SERVICES
EXPORTS (Receipts)
- As per the latest press release by RBI dated 14thAugust 2020, exports in June2020 were USD 17.00 billion (₹ 1,28,697.70crore) registering a negative growth of (-) 8.39 per cent in dollar terms, vis-à-vis June2019. The estimated value of services export for July2020* is USD 16.65 billion.
IMPORTS (Payments)
- As per the latest press release by RBI dated 14th August,2020 imports in June 2020 were USD 9.96 billion (₹ 75,423.89 crore) registering a negative growth of (-) 15.29per cent in dollar terms, vis-à-vis June2019. The estimated value of service import for July2020* is USD 9.65 billion.
III.TRADE BALANCE
- MERCHANDISE: The trade deficit for July2020 was estimated at USD4.83billion as against the deficit of USD13.43billion inJuly2019, which is a decline of (-) 64.06 percent.
- SERVICES: As per RBI’s Press Release dated 14th August, 2020 the trade balance in Services (i.e. Net Services export) for June 2020 is USD7.04 billion. The estimated trade balance in July 2020* is USD 6.99 billion.
- OVERALL TRADE BALANCE: Taking merchandise and services together, overall trade surplus for April-July 2020-21* is estimated at USD14.06 billion as compared to the deficit of USD33.50billion in April-July 2019-20.
*Note: The latest data for services sector released by RBI is for June2020. The data for July2020 is an estimation, which will be revised based on RBI’s subsequent release.
MERCHANDISE TRADE
EXPORTS & IMPORTS : (US $ Billion) |
(PROVISIONAL) |
| JULY | APRIL-JULY |
EXPORTS(including re-exports) | | |
2019-20 | 26.33 | 107.41 |
2020-21 | 23.64 | 74.96 |
%Growth 2020-21/ 2019-20 | -10.21 | -30.21 |
IMPORTS | | |
2019-20 | 39.76 | 166.80 |
2020-21 | 28.47 | 88.91 |
%Growth 2020-21/ 2019-20 | -28.40 | -46.70 |
TRADE BALANCE | | |
2019-20 | -13.43 | -59.39 |
2020-21 | -4.83 | -13.95 |
| | |
EXPORTS &IMPORTS: (Rs. Crore) | |
(PROVISIONAL) | |
| JULY | APRIL-JULY |
EXPORTS(including re-exports) | | |
2019-20 | 1,81,190.34 | 7,45,174.85 |
2020-21 | 1,77,305.79 | 5,66,322.06 |
%Growth 2020-21/ 2019-20 | -2.14 | -24.00 |
IMPORTS | | |
2019-20 | 2,73,579.71 | 11,57,232.64 |
2020-21 | 2,13,499.56 | 6,71,894.74 |
%Growth 2020-21/ 2019-20 | -21.96 | -41.94 |
TRADE BALANCE | | |
2019-20 | -92,389.37 | -4,12,057.79 |
2020-21 | -36,193.77 | -1,05,572.68 |
SERVICES TRADE
EXPORTS & IMPORTS (SERVICES) : (US $ Billion) |
(PROVISIONAL) | June 2020 | April-June 2020-21 |
EXPORTS (Receipts) | 17.00 | 50.21 |
IMPORTS (Payments) | 9.96 | 29.20 |
TRADE BALANCE | 7.04 | 21.01 |
| | |
EXPORTS & IMPORTS (SERVICES): (Rs. Crore) |
(PROVISIONAL) | June 2020 | April-June 2020-21 |
EXPORTS (Receipts) | 1,28,697.70 | 3,80,958.13 |
IMPORTS (Payments) | 75,423.89 | 2,21,522.27 |
TRADE BALANCE | 53,273.80 | 1,59,435.86 |
Source: RBI Press Release dated 14th August2020 | |
Click here to see Quick Estimates for Selected Major Commodities for July 2020
Trade balance shows overall surplus despite sharp year on year decline in exports and imports during April-July Merchandise exports in July 2020 were USD 23.64 billion (Rs. 1,77,305.79 crore) and cumulative April-July exports fell to USD 74.96 billion from USD 107.41 billion, while imports in July 2020 were USD 28.47 billion (Rs. 2,13,499.56 crore) with April-July imports at USD 88.91 billion versus USD 166.80 billion previously. Oil and non oil import categories both registered substantial year on year declines; services receipts and payments for June 2020 contracted (exports USD 17.00 billion; imports USD 9.96 billion) and July services values are estimated. Combined merchandise and services yield an overall surplus for April-July 2020-21, pending RBI revisions.